Mapping and Valuing Ecosystem Services for Integrated Management
Full Solution
Team members
CZMAI
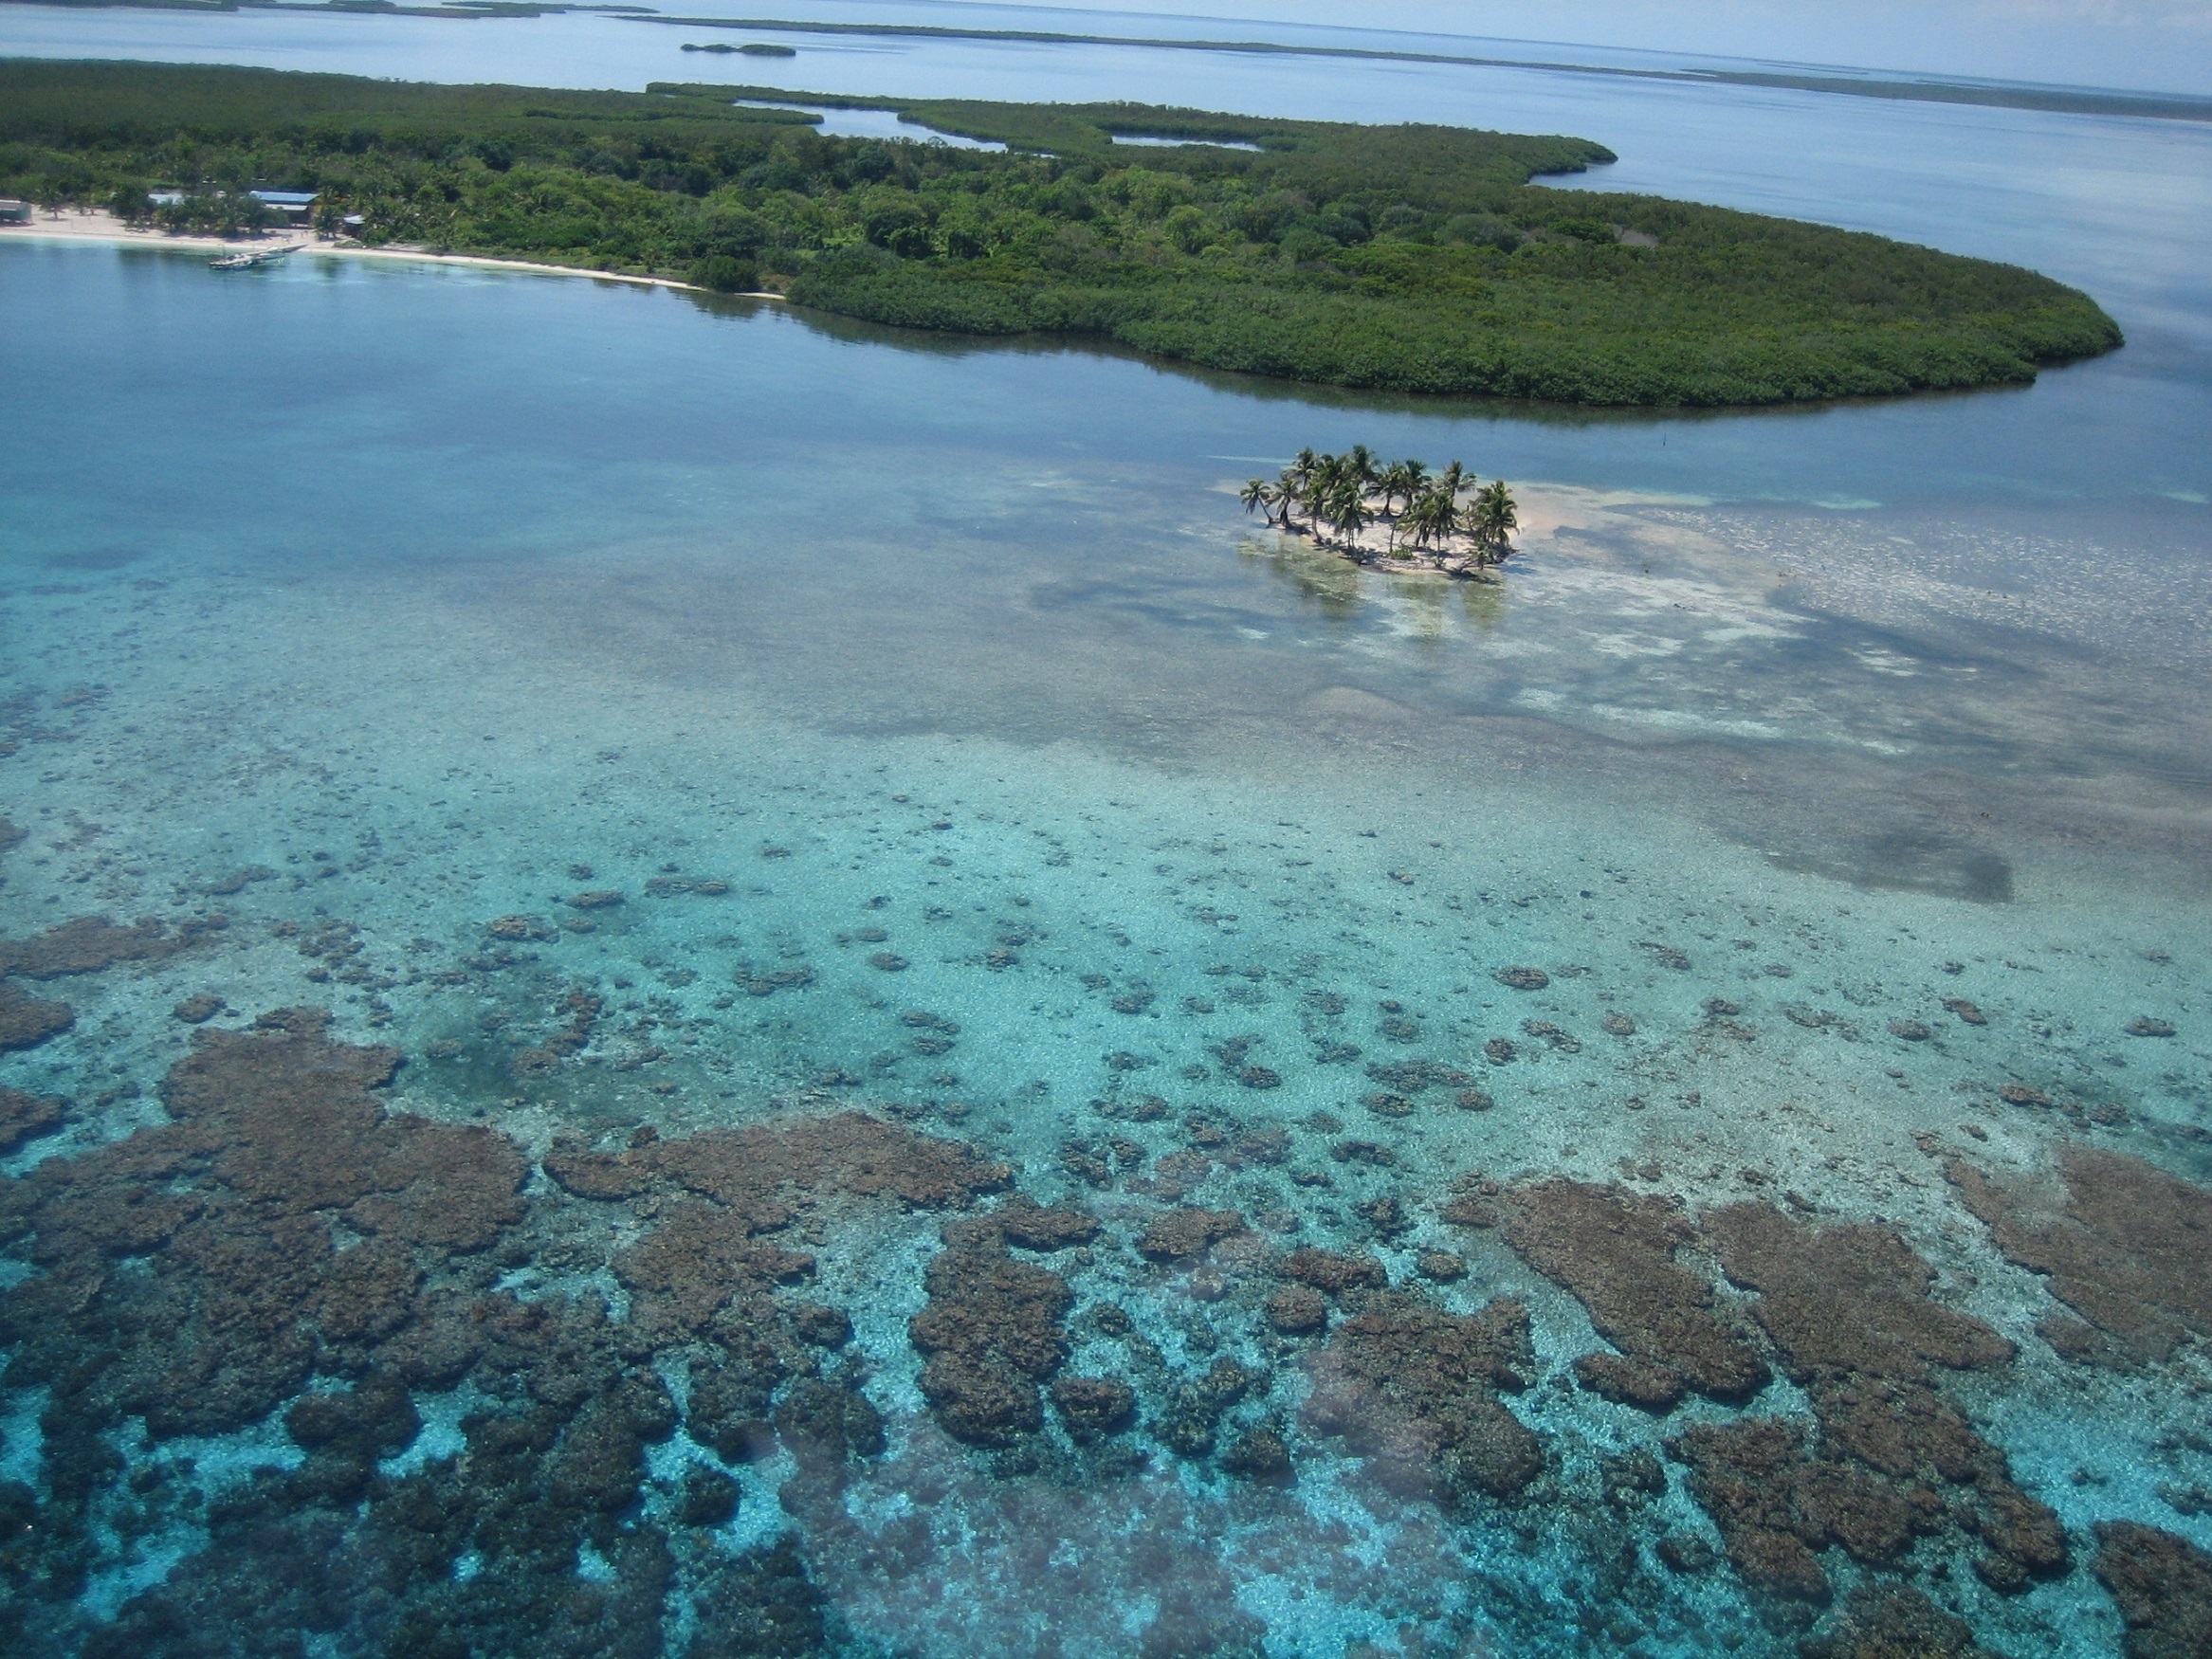
Ecosystem services were mapped and valued in a participatory process that included designing spatially-explicit scenarios of future human uses throughout Belize's coastal zone. To understand the implications of different development scenarios, the team used InVEST models to map future value of coastal protection, recreation, and fisheries services. The resulting Plan can help the people of Belize plot a wiser course for managing the incredibly valuable resources their ocean and coast provide.
Last update: 28 Mar 2019
6513 Views
Photo and video gallery

Context
Challenges addressed
- Multiple, competing uses in coastal zone
- Lack of integrated planning
- Lack of spatial data and tools to create the country’s first national integrated coastal zone management plan
Location
Belize
Caribbean
Process
Summary of the process
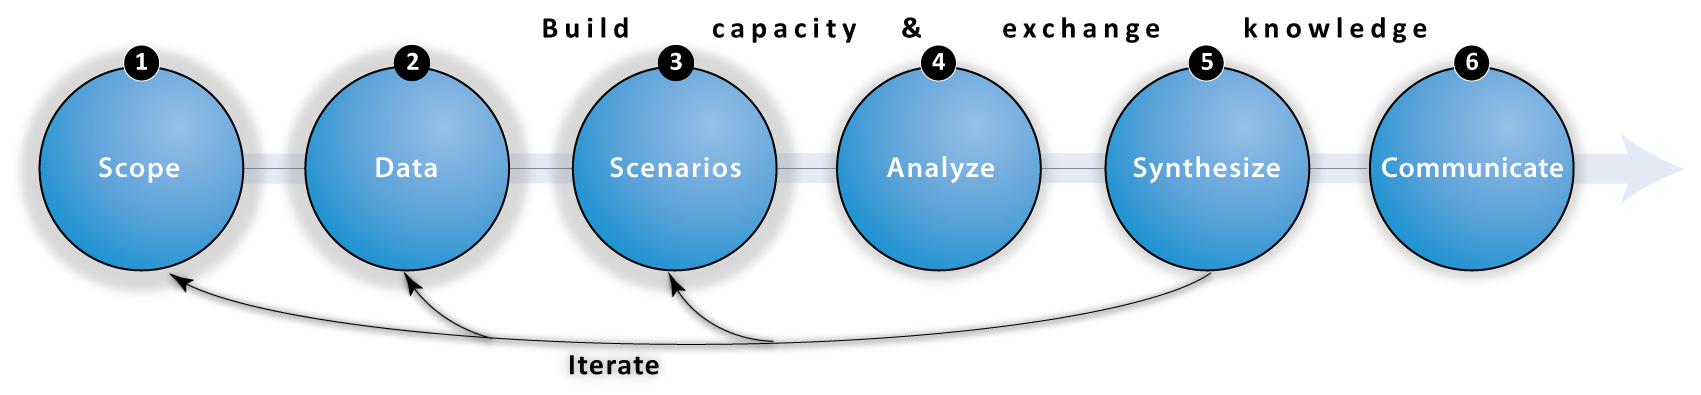
These three building blocks illustrate the science-policy process carried out in Belize. It includes an emphasis on iterative stakeholder engagement, advancing science to address policy needs, and capacity-building through six general steps: (1) scope the process, (2) collect and compile data, (3) develop scenarios, (4) analyze ecosystem services, (5) synthesize results, and (6) communicate knowledge.
Building Blocks
Multi-sectorial Advisory Committees
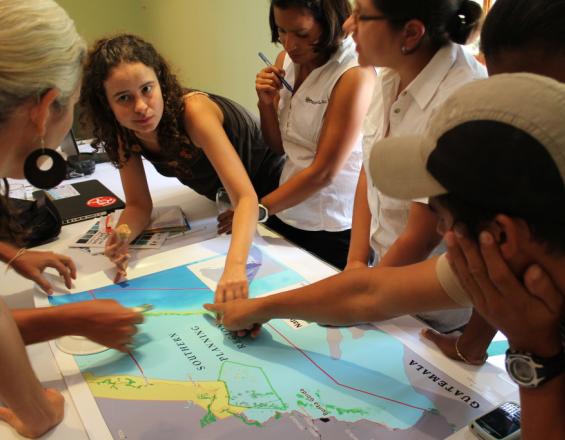
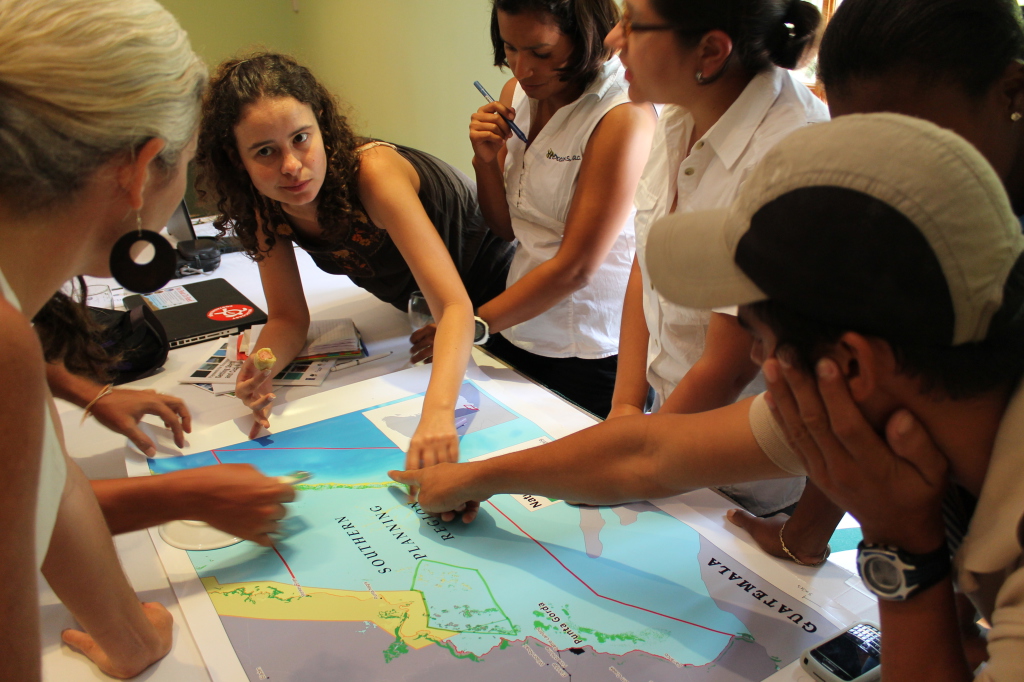
Coastal Advisory Committees represent a range of sector and interest stakeholders convening regular meetings to offer recommendations to the Coastal Zone Management Authority and Institute (CZMAI). Broad engagement is reached through a public review of the draft plan. CZMAI gathers information on stakeholder values, and together with NatCap combines it with data and maps on current and plausible future distribution of uses, economic forecasts and existing government plans. The result is a set of future scenarios reflecting stakeholder input.
Enabling factors
- Convening regular meetings and public consultations.
- Diverse membership (academia, civil service, planners, scientists, NGOs, etc.).
- Share all meeting records including minutes and map annotations and use them as a basis for a work plan.
Lesson learned
- Multi-sectorial advisory committee members appreciate being included in the process and able to voice their concerns and visions for the future.
- Hosting multi-sectorial advisory committee meetings is expensive because it requires covering room, board and transportation expenses of participants.
- A public review period where citizens could comment on the draft plan was very valuable.
Scenario Development
Three future scenarios are developed with input from stakeholders providing local information on human uses and preferences for future location and intensity. Stakeholders also suggest specific changes to the scenarios, based on known alternative development plans or future natural resource uses. Simple tools (e.g. NatCap’s online mapping tool InSEAM) and exercises help stakeholders understand what scenarios are and how alternative spatial development decisions can affect natural capital and benefits delivered to people.
Enabling factors
- Interdisciplinary team, including planner, GIS analyst, ecologist and social/political scientist to convene the meetings and encourage feedback from the stakeholders.
- Collect spatial information using maps and note taking.
Lesson learned
- Scenario development is a time consuming and iterative process that requires multiple stages of review and refinement.
- It is critical to bring maps and other reference information to the meetings in order to stimulate a robust discussion.
Resources
Synthesis – Communicating Ecosystem Services Information
Synthesis ensures that the outputs of your ecosystem services analysis directly inform on-the-ground planning and policies. Here we illustrate how different scenarios of human uses in the coastal zone affect livelihoods and the benefit that people derive from nature. This includes identifying where particular ecosystem service incentives and government policies could be implemented to support a sustainable plan for the future. The goal is to maximize economic opportunities and minimize environmental degradation. The Belize Coastal Zone Management Authority & Institute used a variety of mediums to communicate results, including reports, executive summaries, peer-reviewed papers, presentations and interactive maps all tailored to intended audiences.
Enabling factors
- Obtaining and appropriately using data to complement results generated from scenarios assessment is critical.
Lesson learned
- The selection and quantification of metrics that resonate with decision makers can be the most difficult step.
- Synthesis is most successful when it translates information about ecosystem service outcomes into helpful, specific recommendations for management and policies through clear conclusions and captivating stories.
Impacts
- Advancing the management and conservation of coastal and marine environments, and explicitly accounting for nature’s benefits to people
- Blends stakeholder engagement with science models of ecosystem services and makes it available to policy makers
- Model results suggest higher return in ecosystem services than ad hoc development decisions
Beneficiaries
- coastal land owners
- fisherfolk
- industrial and tourism sector
- indigenous populations
Sustainable Development Goals
SDG 8 – Decent work and economic growth
SDG 14 – Life below water
Story
Mapmaking makes a difference in Belize Gregg Verutes, WWF GIS analyst: As an expert in GIS mapping, I expect my maps to work behind the scenes. The multilayered depictions I construct to illustrate the ways we use and value nature, usually inform scientists, practitioners and policy makers. They rarely feature prominently on televised efforts to secure sustainable national energy policy. But exactly that happened recently in Belize. A simple map I made at the urging of a tour guide helped defeat a proposal to intensify offshore oil drilling. Our team was in Belize for a training but Hurricane Rina forced us to cancel. I took advantage of the free time to visit the Mayan ruins. As we bounced along the winding road in a jeep, my guide Carlos inquired about my occupation. I explained that I translate data about the potential environmental impacts of natural resource use into visual representations of how nature benefits people. “Oh, so you make maps?” he asked. “Yes, basically.” His face took on an excitement I rarely see when discussing GIS. “You know what would be great? Make a map of the US Gulf oil spill and put it on top of Belize!” he said. “People are arguing about oil drilling around Belize. It would help to show what’s at stake if a similar disaster happened here.” It was one of those light bulb moments. As a mapmaker I have a pretty good sense of the relative size of various countries and bodies of water, but the map I created surprised even me. I knew that the oil spill would look large compared to Belize, but I was taken aback to see how thoroughly the black splotch covered its coastline. The map showed how an oil spill of this magnitude off the coast of Belize would devastate the country. Almost half of Belizeans draw their livelihoods from the coast, whether from fishing, tourism or other ocean-oriented occupations. I sent the map to an organization called Healthy Reefs for Healthy people Initiative, which started incorporating the image into signs and television ads that urged people to vote “no” in the upcoming People’s Referendum. In the end over 90 percent of Belizeans voted against oil exploration and drilling offshore. The map was made with advanced technology, but needed no explanation. The arresting image showed starkly how valuable nature is to the health and well-being of the people. And those people took action to protect the ecosystem they depend on. What more could a humble mapmaker ask for?