Dashboards and Indicators for the Blue Economy

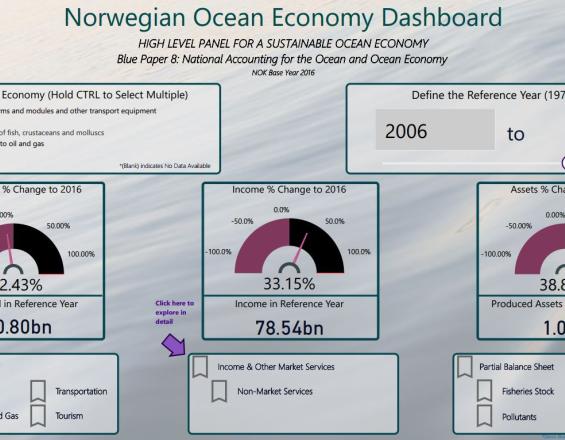
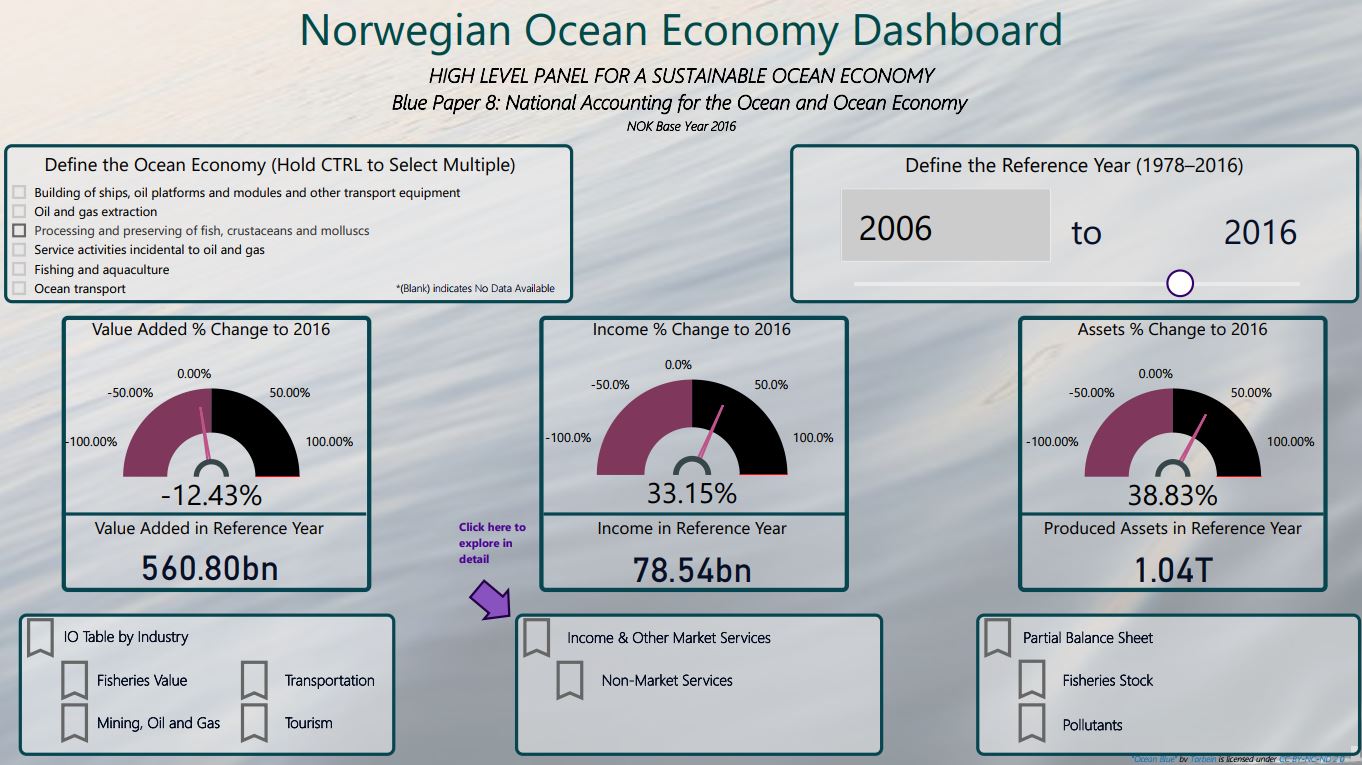
The oceans are integral sources of economic growth and prosperity for many regions. Quantifying their importance and assessing their sustainable use require more than a single headline indicator such as “ocean GDP.” While headline indicators can be useful tools for summarizing complex data, production-focused indicators that reflect the share of the economy tied to ecosystems fall short of being able to assess sustainability and the health of ocean assets. Much of the ocean economy rests on the use of natural capital; however, such asset depletion is not captured in GDP-like measures. Multiple indicators capturing degradation of natural capital and productive flows must be used. The availability of digital dashboarding tools makes generating these indicators relatively easy and allows them to be nimble in responding to bespoke policy questions. Here, we demonstrate the dashboarding technique using the ocean economy in Norway as an example through publicly available data from Statistics Norway.
Photo and video gallery
Context
Challenges addressed
The sustainable use of our marine and coastal resources requires combining economic, social, and environmental data. For many countries, these data are collected by different ministries, at different intervals, and may not be readily synthesized for policymaking. Ocean accounts and digital data dashboards facilitate bringing these data together under a consistent, comprehensive, and comparable framework so that existing data can be used fully and gaps in data can be readily identified.
Location
Process
Summary of the process
Dashboards of multiple indicators to assess the sustainability of a country's ocean economy require data from various ministries to be collected periodically. These data support the tabulation of asset balance sheets which are crucial for benchmarking the tradeoffs between economic flows and depreciation/drawdown of the asset base that generates these flows.
Building Blocks
Asset Balance Sheets
Asset balance sheets log the stocks of assets and their values in the national accounts. Whereas flows of economic production--goods and services--have been used as primary indicators of the "health" of an economy, these measures do not take into account depreciation or degradation of the asset base form which these flows stem. Changes in the asset balance sheet would reflect, for example, the reduction in value of depleted fisheries stocks.
Enabling factors
An asset balance sheet is useful for natural capital accounting and assessing the blue economy requires periodic assessments of asset stocks that are systematically collected and comparable. This would mean regular assessments of fishery stocks, undersea ocean and mineral deposits, and port infrastructure to name a few. Monetary accounts require prices for non-market natural capital assets.
Lesson learned
- While monetary accounts are the ideal, physical accounts (e.g. kg spawning stock biomass) can be useful where market prices do not exist.
- Tracking changes in the asset balance sheet are more important than a comprehensive asset balance sheet compiled as a one-off exercise. These data must be collected with regularity to be useful for tracking the sustainability of the blue economy.
Interagency Data Standards and Access
Rather than harmonize data after it is collected, interagency standards for collecting underlying data for physical and monetary accounts will allow data to be aggregated and disaggregated, merged and filtered with ease. These standards should cover data storage and collection so that data collected over time are comparable. Further, sharing data across ministries and departments will prevent recollecting data when they exist.
Enabling factors
- Interagency cooperation
- Statistical offices empowered to set standards
- Data security and underlying support infrastructure
Lesson learned
Fit-for-purpose data collection to answer particular policy questions may be redundant unless the full scope of existing data collection efforts are accessible and able to be disaggregated. Data to support ocean accounting may already exist, but are collected by environment ministries as well as by commerce and transport ministries.
Impacts
Using digital dashboards to assemble and synthesize data from ocean accounts can improve decision making for the blue economy. The ability of digital dashboards to readily disaggregate multiple indicators to specific industries, time periods, or geographic regions can help quickly resolve disagreements about what scope is relevant and the significance—or insignificance—of different boundary definitions for potential policy outcomes. The “zooming-in” that digital dashboards enable allow stakeholders to locate themselves, or their communities, in the data without requiring retabulation by statistics offices.
Beneficiaries
Beneficiaries of employing dashboarding approaches for natural resource management and accounting include policymakers, stakeholders in marine and coastal areas, national statistics officers, and beyond.