Les citoyens sont encouragés à être curieux de la qualité de l'air
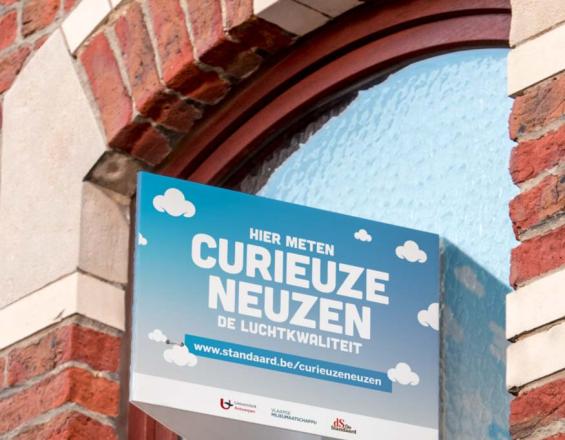
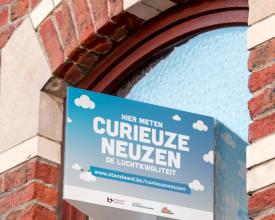
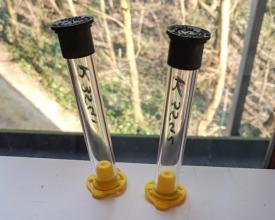
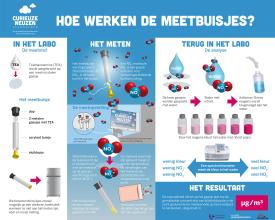
CurieuzeNeuzen est un jeu de mots flamand difficile à traduire qui désigne une personne curieuse d'apprendre. Il s'agit du plus grand projet de science citoyenne jamais réalisé pour surveiller la qualité de l'air dans l'ensemble de la région flamande de Belgique. Plus de 53 000 candidats se sont inscrits, parmi lesquels 20 000 citoyens, mais aussi des organisations, des écoles et des entreprises ont été sélectionnés pour participer. Chacun a reçu une boîte à outils conviviale qui lui a permis de mesurer la concentration de NO2 dans sa rue, qui provient principalement de la combustion de carburants fossiles. Les participants ont fixé un panneau d'affichage en forme de V sur leur fenêtre du premier étage, côté rue. Deux échantillonneurs passifs de NO2 fixés à l'intérieur ont recueilli des données du 28 avril au 26 mai 2018. Les participants étaient impatients de connaître leurs résultats puisque plus de 99 % d'entre eux ont renvoyé leurs tubes pour traitement. À l'échelle internationale, c'était la première fois que des citoyens participaient activement à une telle échelle à un projet scientifique sur la qualité de l'air qui a donné des résultats incroyablement détaillés.
Impacts
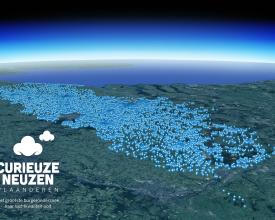
Le résultat le plus marquant du projet CurieuzeNeuzen est une carte interactive à échelle réduite qui permet aux citoyens d'explorer les concentrations de NO2 dans toute la Flandre à l'aide d'un code couleur. Alors que les points verts indiquent une bonne qualité de l'air, les points rouges indiquent des niveaux de NO2 dépassant les réglementations de l'UE et les recommandations de l'OMS. La carte permet aux scientifiques d'analyser l'impact de la circulation et de l'aménagement du territoire sur la qualité de l'air dans les rues, les quartiers et même les villes entières, en mettant en lumière les points chauds de NO2 et en permettant de faire des comparaisons entre les centres urbains et les zones rurales.
L'impact social de cette carte interactive a été immense. Grâce à une campagne de communication à grande échelle qui a expliqué et nuancé les résultats de CurieuzeNeuzen, les habitants de toute la Flandre ont été sensibilisés à la question de la pollution atmosphérique. Les enquêtes ont révélé qu'un grand nombre de participants ont effectivement modifié leur comportement en matière de mobilité, par exemple en optant pour les transports publics ou le vélo pour se rendre au travail. Un autre groupe de participants a indiqué qu'il avait l'intention de procéder à ce changement modal, mais qu'il ne disposait pas de l'infrastructure nécessaire. La carte s'avère donc être un outil important pour les responsables municipaux et les planificateurs qui doivent repenser la façon dont les villes et les municipalités sont conçues pour améliorer la santé de leurs citoyens.

