Citizens are encouraged to be nosy about air quality
Snapshot Solution

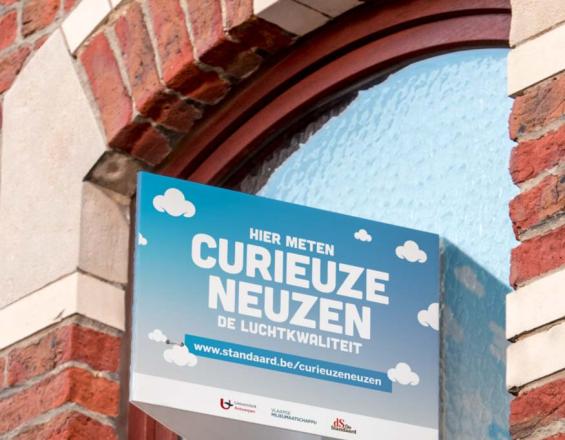
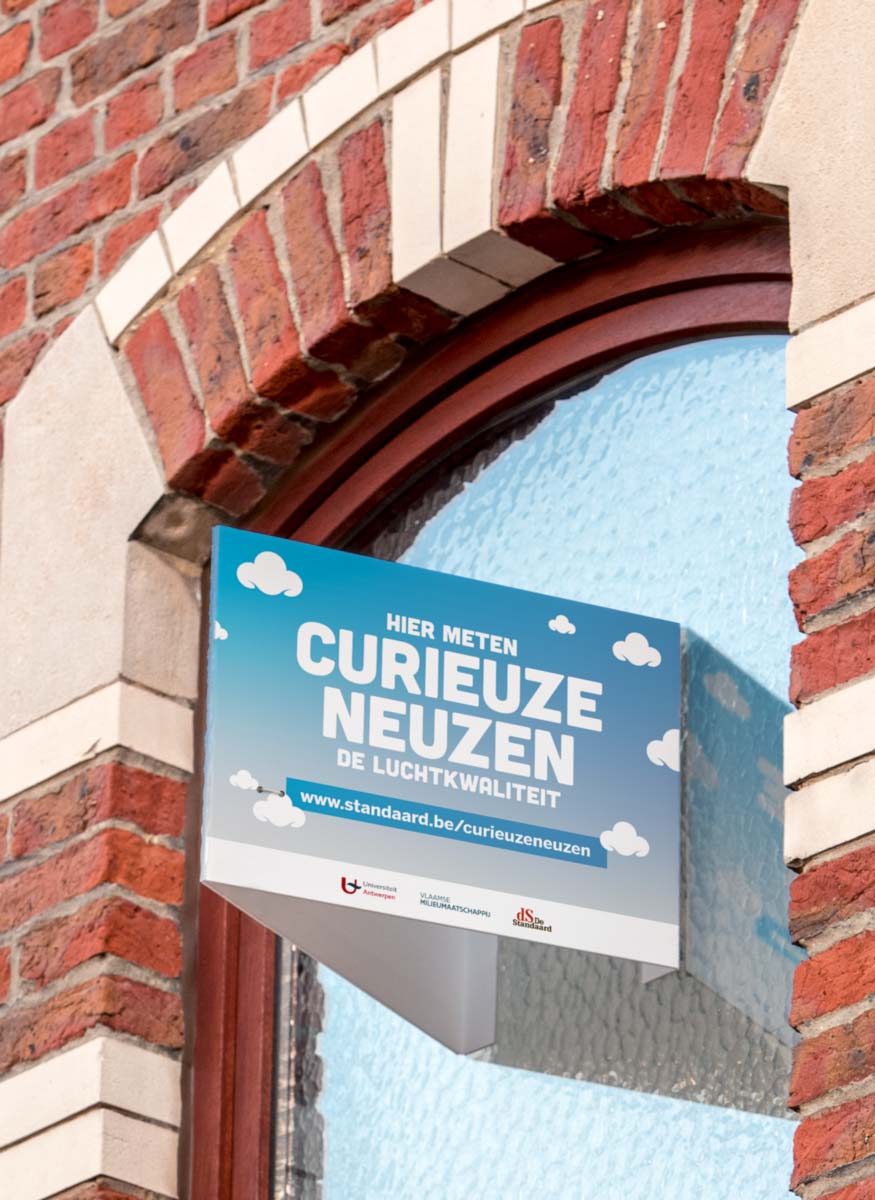
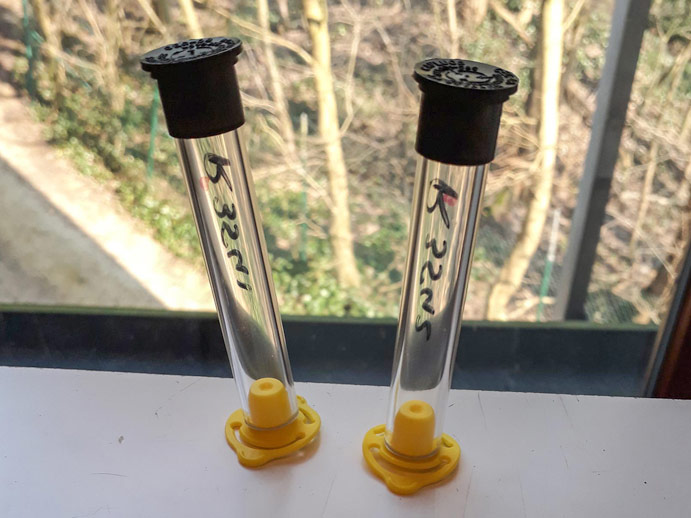
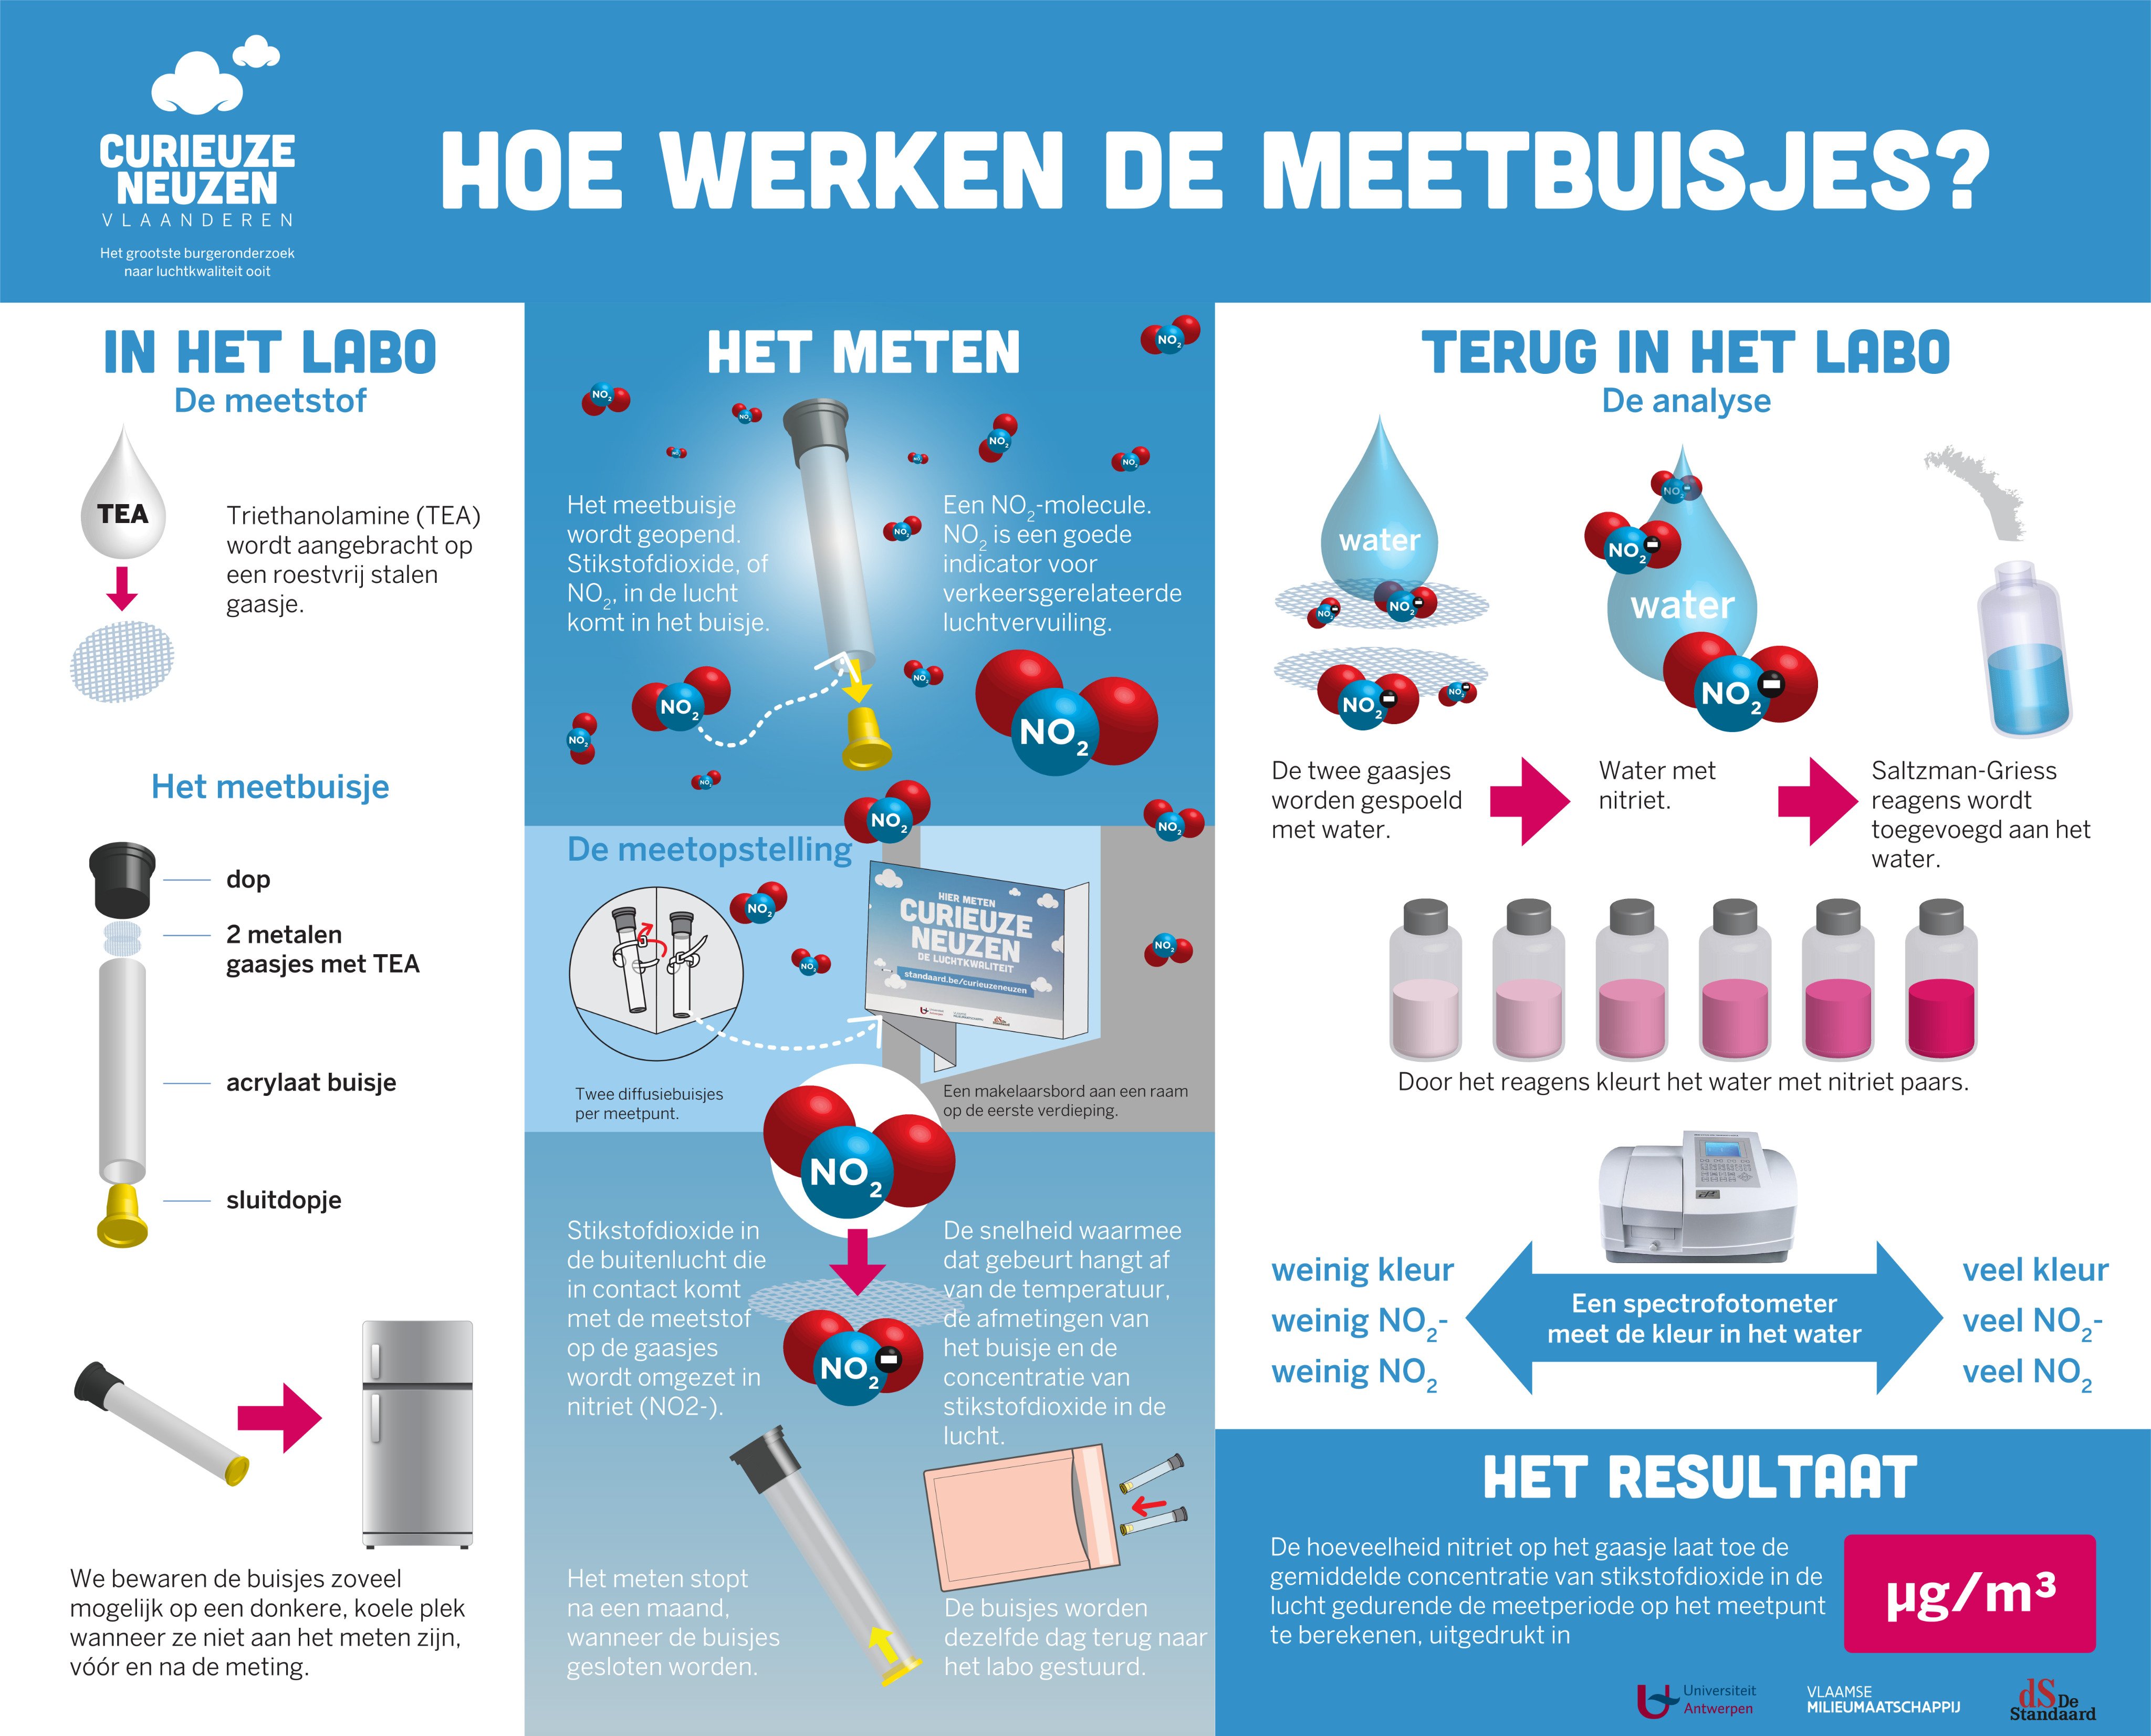
The v-shaped window sign that participants hung outside their window for a month. Two sampling tubes were attached on the inside.
CurieuzeNeuzen
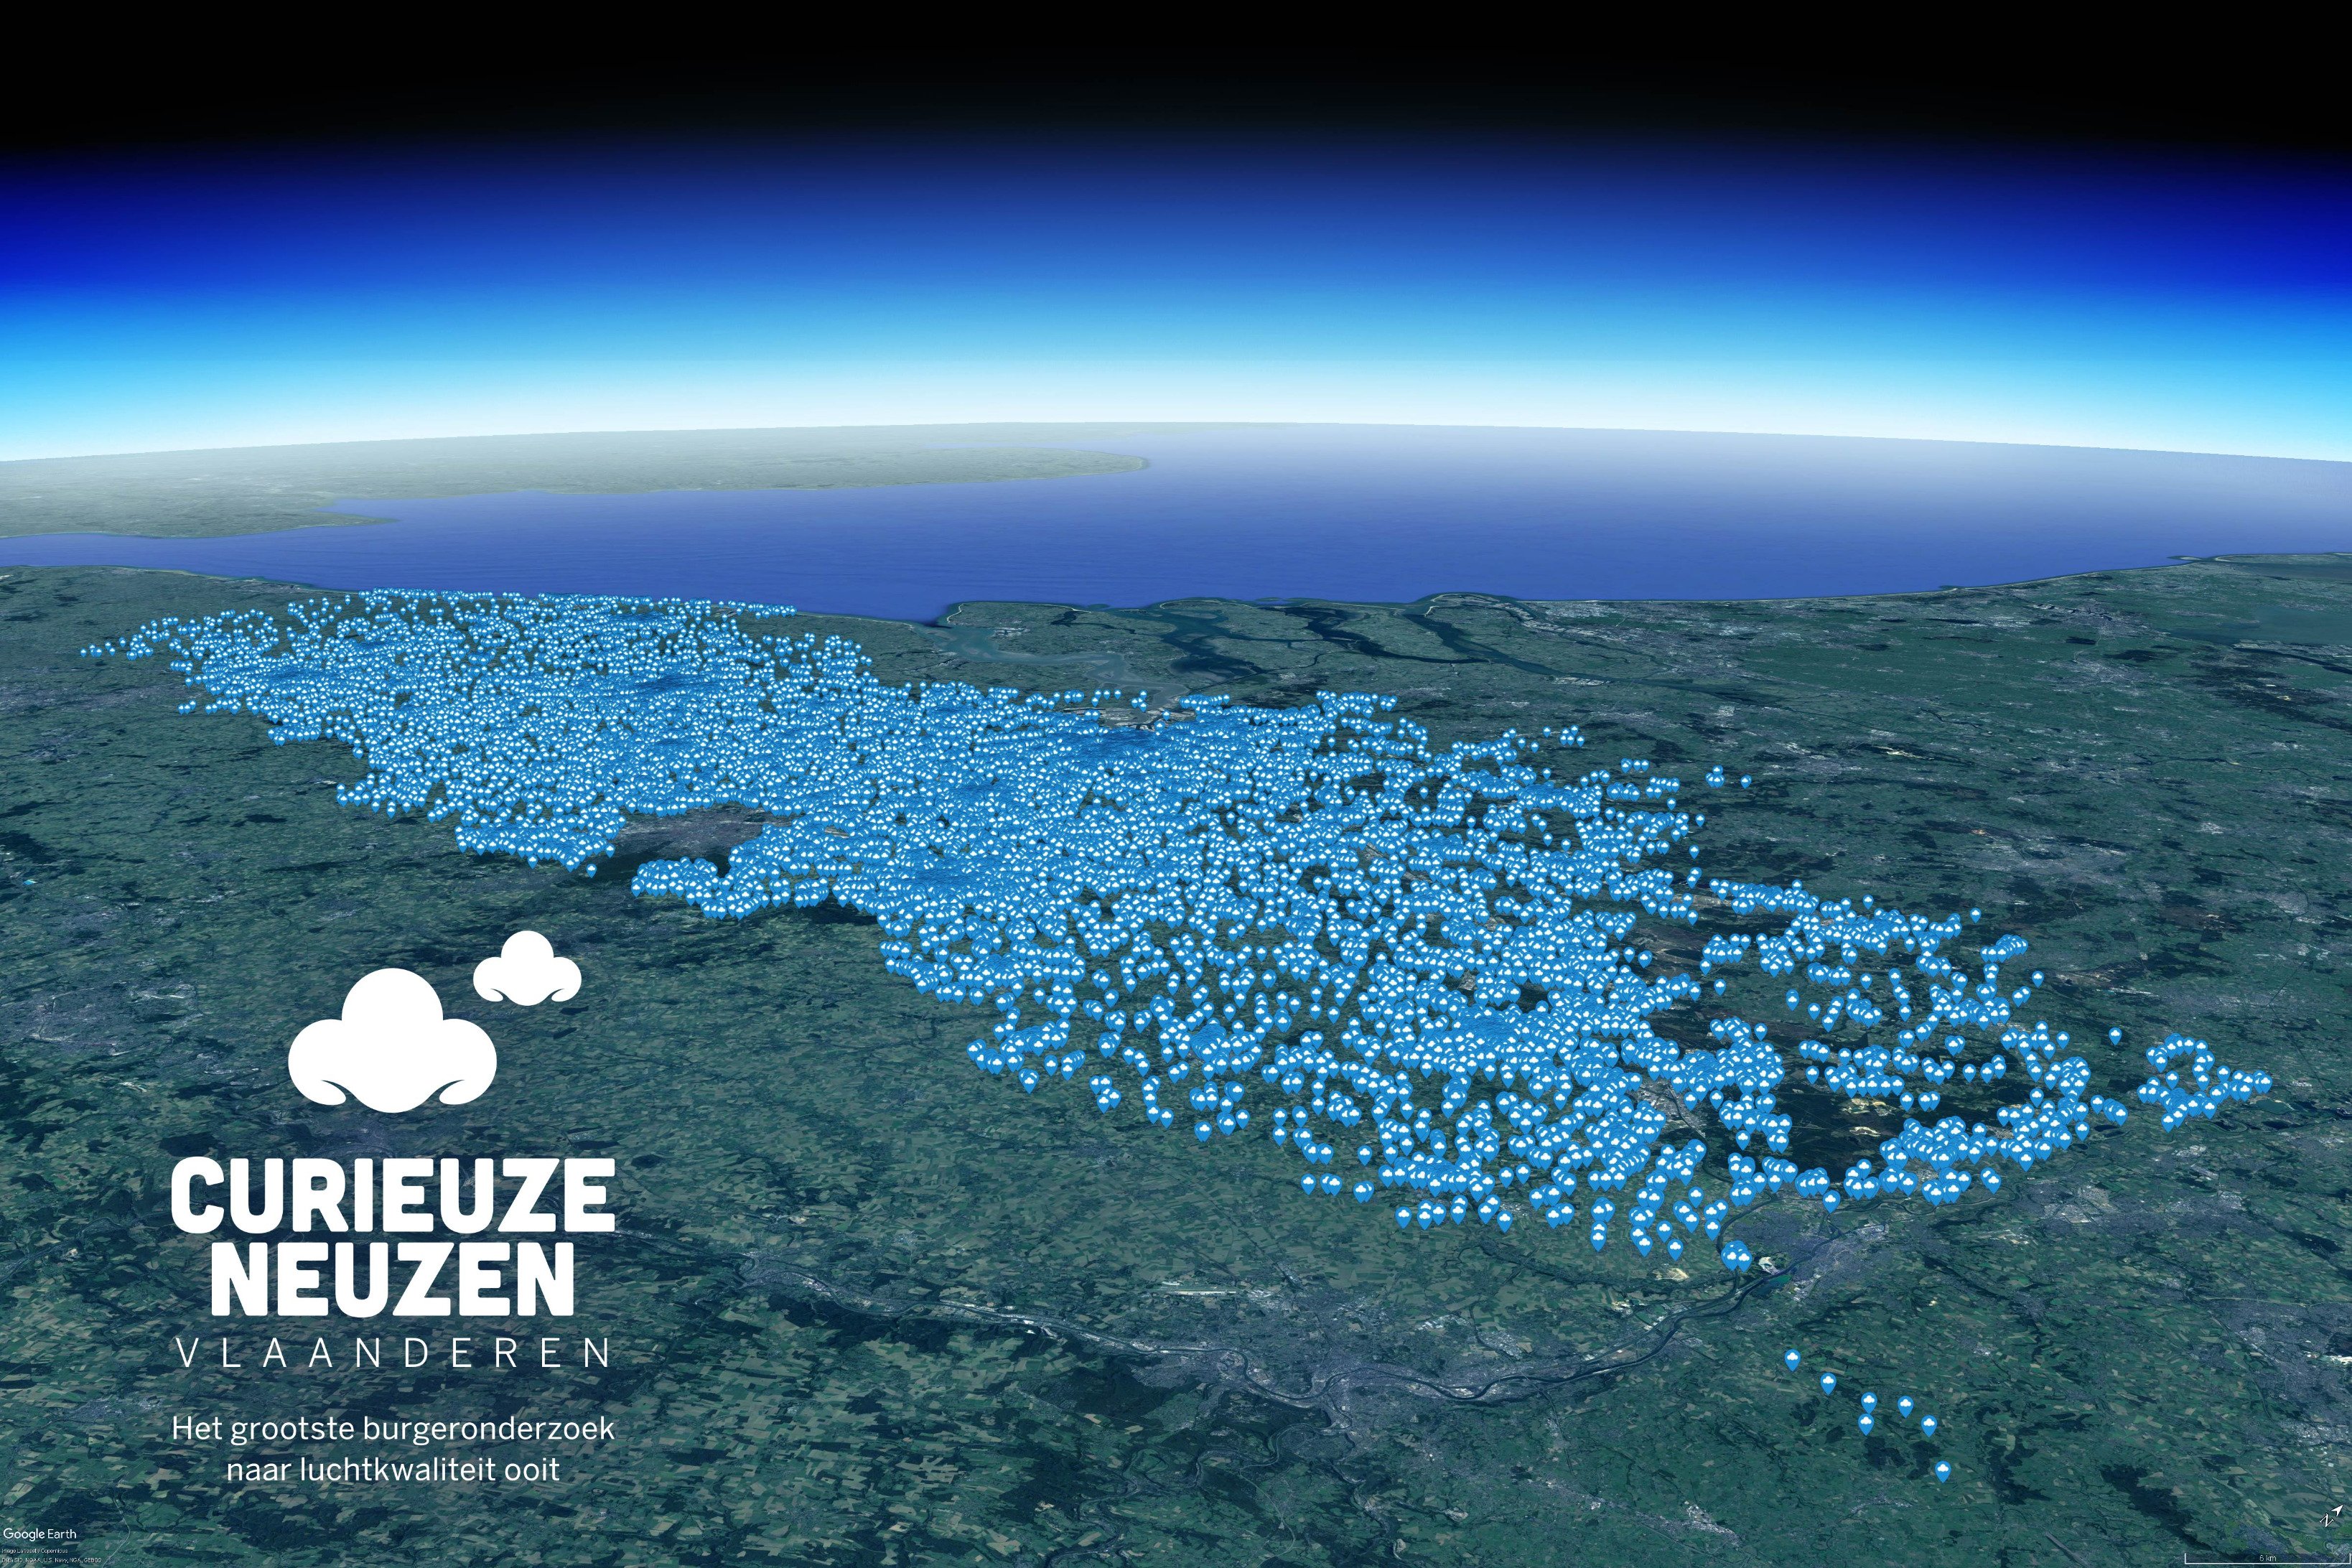
CurieuzeNeuzen is a Flemish wordplay that is difficult to translate but refers to someone who is curious to learn. It is the largest ever citizen science project to monitor air quality throughout the Flanders region of Belgium. Over 53,000 candidates registered, from which 20,000 citizens, but also organisations, schools and companies were selected to participate. They each received a user-friendly toolkit that enabled them to measure their street’s NO2 concentration which is primarily released from the burning of fossil fuels. Participants attached a V-shaped billboard onto their first-floor window on the street side. Two passive NO2 samplers attached within collected data from April 28 until May 26 in 2018. Participants were eager to know their results as more than 99% returned their tubes for processing. Internationally, this was the first time that citizens were actively involved on such a large scale in a scientific project on air quality which yielded incredibly detailed results.
Last update: 04 Mar 2021
2328 Views
Impacts
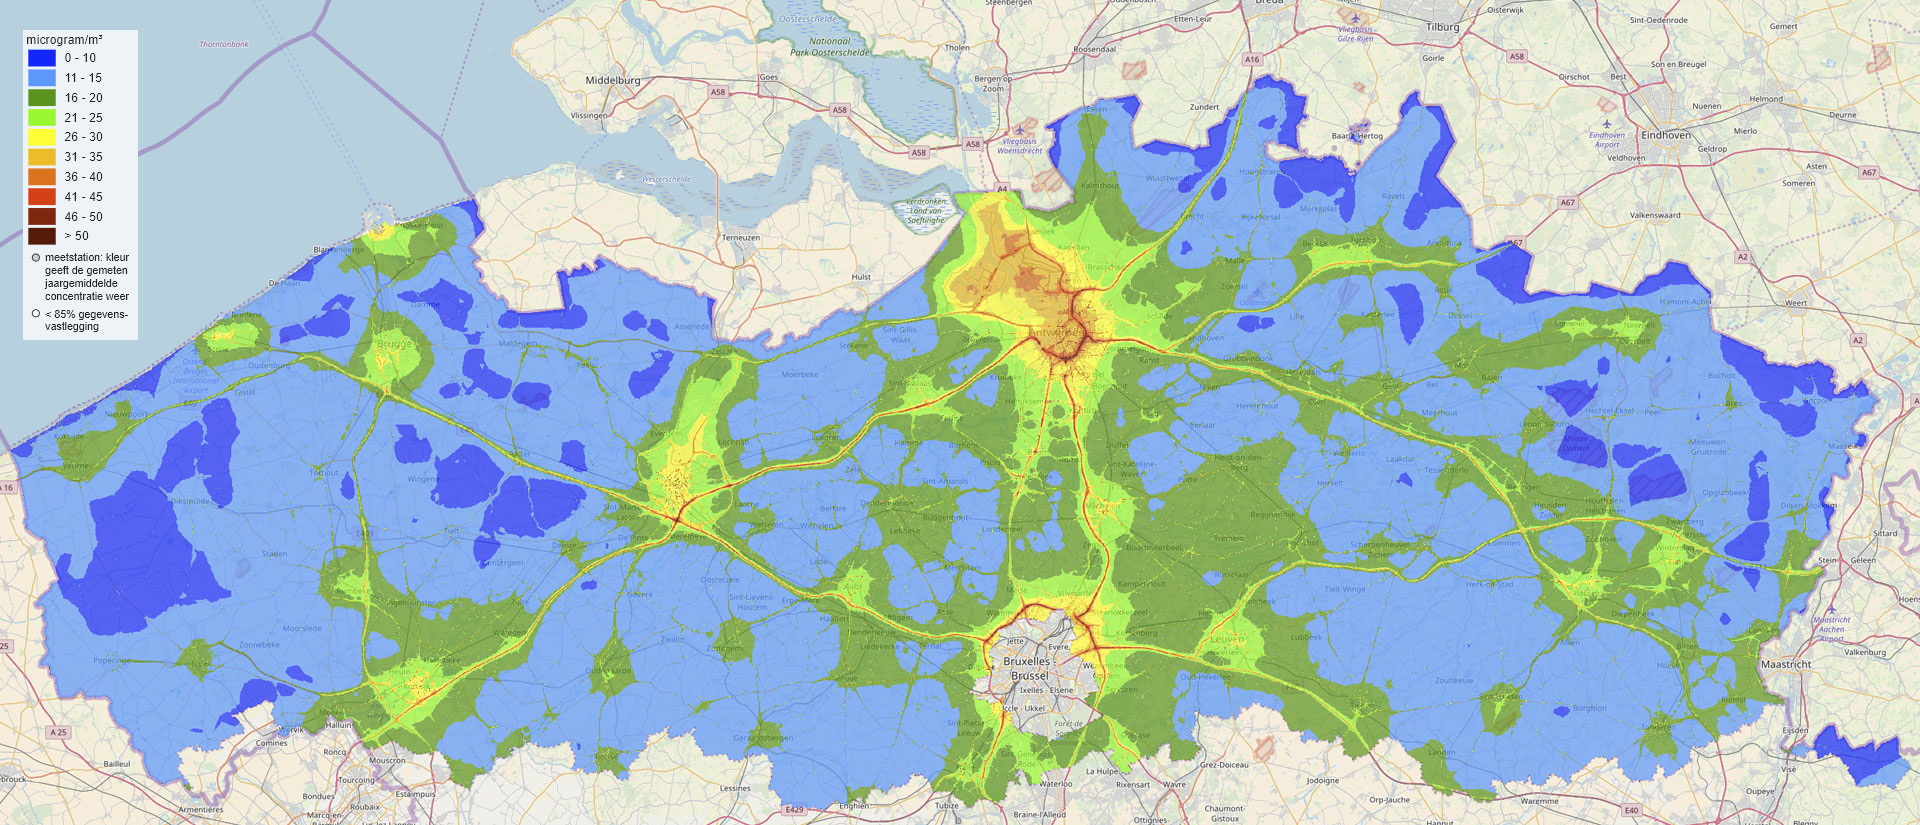
The most impactful outcome of the CurieuzeNeuzen project is a fine-scaled interactive map that enables citizens to explore the NO2 concentrations throughout Flanders with the help of a colour code. While green dots indicate good air quality, red dots indicate NO2 levels exceeding EU regulations and WHO recommendations. The map allows scientists to analyse the impact of traffic and spatial planning on the air quality of streets, neighbourhoods and even entire cities, shining a light on NO2 hotspots and allowing comparisons to be made between urban centres and rural areas.
The social impact of this interactive map was immense. Through a large-scale communication campaign that explained and further nuanced the results of CurieuzeNeuzen, people throughout Flanders became more aware of the issue of air pollution. Surveys revealed that a vast number of participants effectively changed their mobility behaviour, e.g. making the switch to public transport or cycling to commute to work. Another group of participants indicated to have the intention for this modal shift, but they lacked the infrastructure to do so. The map therefore also proves to be an important tool for city officials and planners to rethink how cities and municipalities are designed to improve the health of their citizens.
Sustainable Development Goals
SDG 3 – Good health and well-being
SDG 4 – Quality education
SDG 7 – Affordable and clean energy
SDG 9 – Industry, innovation and infrastructure
SDG 11 – Sustainable cities and communities
SDG 13 – Climate action
SDG 15 – Life on land

