Waste Flow Diagram
Snapshot Solution
Waste Flow Diagram
GIZ
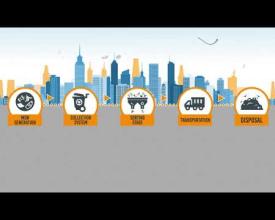
The Waste Flow Diagram (WFD) maps and visualizes municipal solid waste management systems, quantifying waste amounts, sources, and plastic leakage into the environment. Since its inception in 2020, it was applied more than 500 times and supported mainly city authorities in improving their municipal solid waste systems.
Using Material Flow Analysis (MFA), the WFD covers all solid waste management stages, from generation to disposal, enabling informed decision-making to enhance waste services and infrastructure. It also allows scenario simulations to evaluate potential interventions for reducing plastic pollution.
To support WFD assessments, a data portal has been created, featuring computations, graphic generators for Waste Flow and Sankey diagrams, and integration with the Waste Wise Cities Tool. It includes case studies, tutorials, and a forum for peer support. Additionally, a compendium summarizes lessons of worldwide WFD applications, showcasing diverse solid waste management realities and cultural practices.
Last update: 21 Jan 2025
2991 Views
Photo and video gallery
Context
Challenges addressed
Location
Eschborn, Hesse, Germany
West and Central Africa
North Africa
East and South Africa
Caribbean
Central America
South America
Southeast Asia
South Asia
East Asia
East Europe
Impacts
Marine plastic litter poses a global risk to marine ecosystems, fishing and tourism as well as possibly human health. An estimated 11 million tonnes of plastic enters the world's seas each year. This amount could increase to 29 million tonnes by 2040. A large share comes from the rapdily growing consumption of single-use products and packaging worldwide.
Insufficient waste management is considered a major source of marine litter, especially along coats and rivers. Understanding the leaks and pathways of plastic waste into the environment is key in developing effective measures to beat plastic pollution.
The WFD was designed to support stakeholders in planning and monitoring local interventions and has been taken up by various international and local institutions, e.g. in combination with the UN-Habitat SDG 11.6.1 assessments in about 50 cities and mega cities.
Sustainable Development Goals
SDG 11 – Sustainable cities and communities
SDG 12 – Responsible consumption and production
SDG 14 – Life below water