SeaSketch: A web-based tool for participatory marine spatial planning
Full Solution


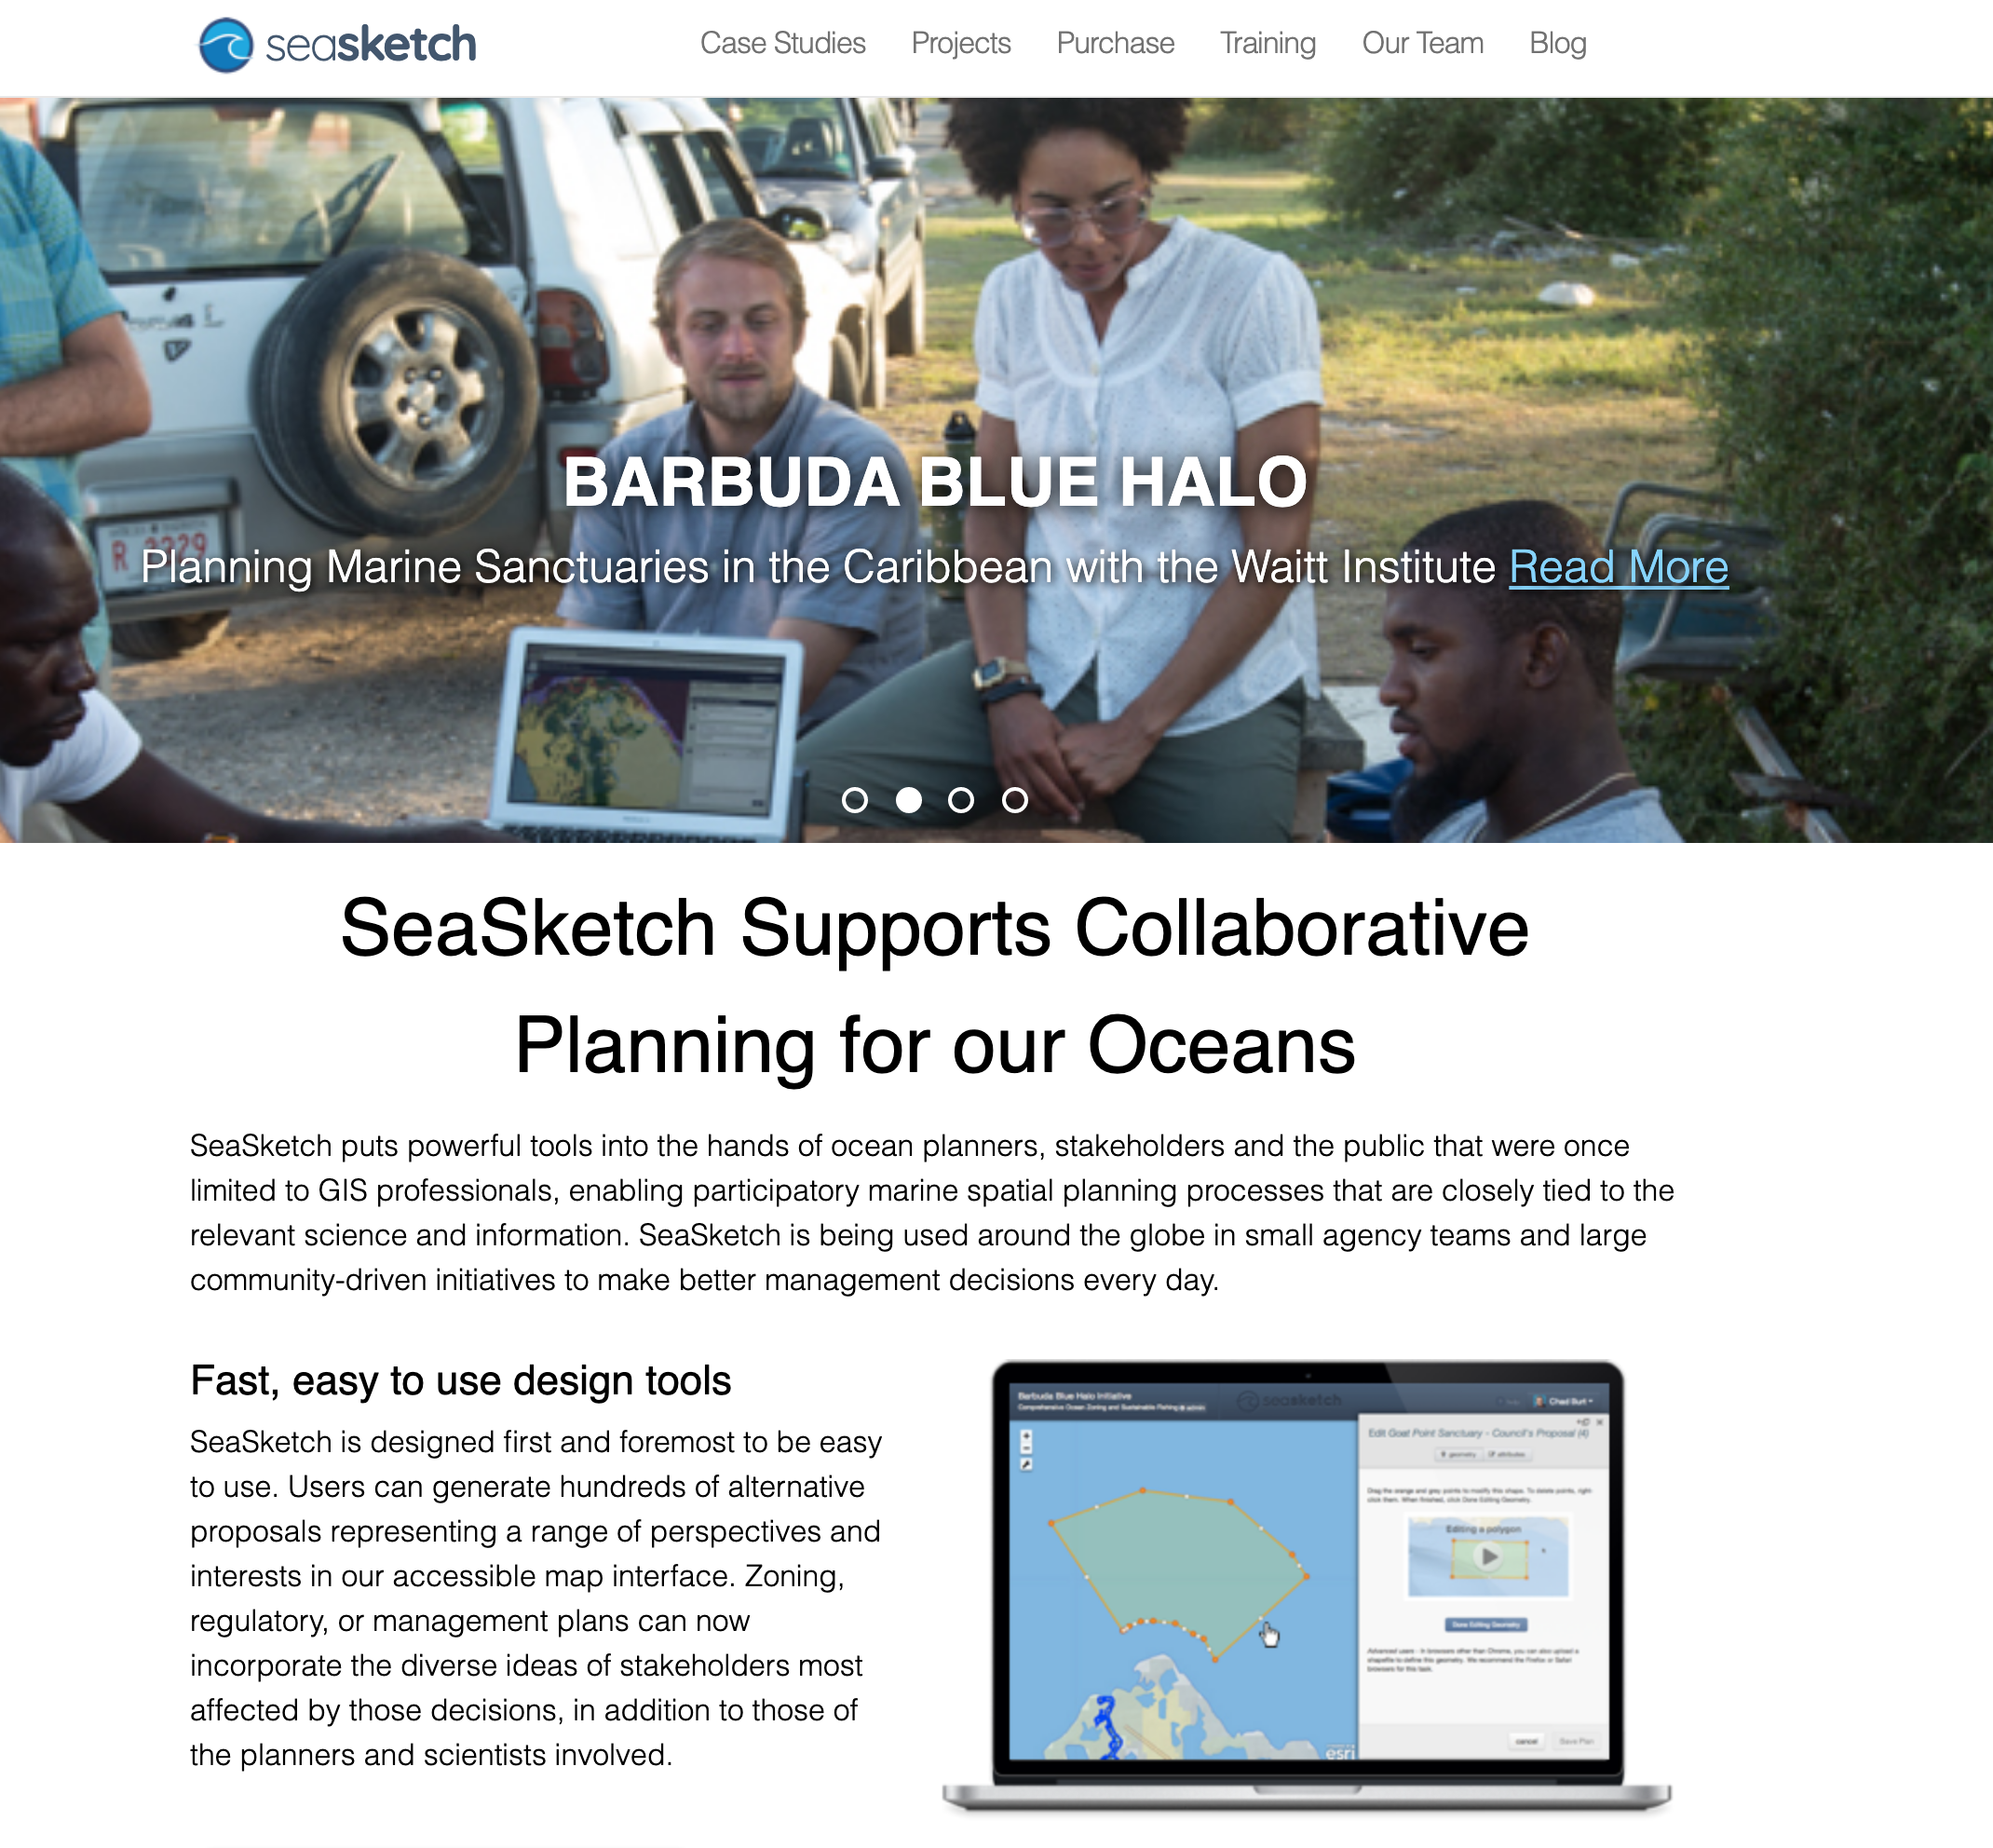
Stakeholders in Barbuda use SeaSketch and paper maps for MSP.
Will McClintock
SeaSketch is a software service for participatory and collaborative mapping. Using simple tools, users may (1) visualize and query maps, (2) contribute knowledge and identify valued areas using map-based surveys, (3) sketch and evaluate prospective zoning scenarios and (4) share and discuss zoning plans in a map-based discussion forum. The platform has been used in many cases to develop comprehensive zoning scenarios that reflect stakeholder values in Marine Spatial Planning (MSP). The tool is currently propriety and requires a purchased license but in January 2022, a new version will be released as free and open source.
Last update: 22 Jan 2021
4410 Views
Photo and video gallery


Context
Challenges addressed
One primary challenge to marine spatial planning is maximizing participation in the planning process by providing Geographic Information Systems (GIS) tools that may be used in a variety of settings (remotely and in-person) by a variety of users (technical and non-technical).
Location
Global
Caribbean
Central America
South America
North America
North and Central Asia
South Asia
West and South Europe
North Europe
Process
Summary of the process
Marine Spatial Planning (MSP) processes are often helped by decision-support tools. Deciding on the tools for critical issues in MSP such as spatial data management and stakeholder engagement is key (BB1 - SeaSketch Software as a Service). Governments need a legal mandate to establish marine spatial plans (BB2 - Government Buy-In for Collaborative Planning), without which plans are unlikely to be adopted.
One begins with collecting the best readily available geospatial information (BB3 - Authoritative Geodata and Map Services). All of these data may be displayed as Data Layers in SeaSketch. New data may be collected by way of Surveys (BB4 - SeaSketch Surveys to Assess Ocean Use). The results of surveys may show the distribution of activities within the ocean. These maps may be considered the “authoritative” database with which users may begin planning.
The primary planning tool is the “sketch”, a prospective plan element (BB5 - Sketching and Evaluating Prospective Zones). Sketches may be analyzed to indicate if the plan meets its objectives. The Forums offer a means by which users may share and discuss prospective zones.
Building Blocks
SeaSketch Software as a Service
In most cases, SeaSketch is used to support large-scale planning efforts where governments have mandated the establishment of a marine spatial plan and where broad stakeholder involvement is essential. In these cases, SeaSketch must be licensed by a lead agency or partner. SeaSketch may be used to visualize geospatial data as map services, collect to information via surveys, sketch and discuss plans. If plans are to be evaluated using analytics, geoprocessing services and reports must be developed in our lab. Note that a free license is available for educational institutions to use SeaSketch for strictly educational purposes.
In January 2022, we will release the next version of SeaSketch which will be entirely free and open source. Just as with the current version, many of the features within SeaSketch may be configured with minimal knowledge of or experience with GIS. The analytics and reports will be run on lambda and encoded using programming languages such as Javascript. Owners of projects may, therefore, set up their own SeaSketch project – from beginning to end – without intervention from our lab. It should be noted, however, that the geoprocessing and reporting framework, though free and open source, will require significant programming experience.
Enabling factors
Currently the implementing agency (such as a government body, foundation or NGO) must purchase the license and contract for developing analytics. The current version requires an Internet connection, but the next version will include some offline capabilities. Successful implementation of SeaSketch will require some assistance from a GIS technician, for example publishing and importing map services.
Lesson learned
SeaSketch is extremely valuable in creating a transparent and collaborative atmosphere, maximizing stakeholder participation, and grounding decisions in science-based information. We see the best results when SeaSketch is used in combination with other tools such as desktop GIS applications, trade-off analyses, prioritization tools (e.g., Marxan, Prioritizr), and cumulative impact analyses.
Government Buy-In for Collaborative Planning

SeaSketch is designed to be used primarily for collaborative planning. We've focused on Marine Spatial Planning, but the software can be used for terrestrial planning as well. Furthermore, the software is intended to help generate ocean zoning solutions. If these zones are to have a meaningful impact, such as conservation or benefits to the blue economy, there needs to be buy-in to the planning process by the host government institutions. If zones developed in SeaSketch are not legally adopted, they are less likely to have the desired effect.
Enabling factors
A legal mandate for marine spatial planning is essential, without which plans are unlikely to be adopted. Furthermore, successful implementation of SeaSketch requires a genuine commitment to stakeholder engagement at various levels. It is one thing to set up a SeaSketch project with maps, sketch classes, forums and surveys, but it is another thing entirely to structure a planning process so that SeaSketch is used by stakeholders. One must create an accompanying stakeholder engagement plan to ensure stakeholders make good use of the tool.
Lesson learned
A legal mandate for collaborative marine spatial planning and that maximizes stakeholder participation is essential. Without a mandate and a timeline for planning, one can plan for ages without generating a zoning solution. Simply having collaborative planning tools will not ensure that stakeholders will be engaged or that solutions reflect a variety of stakeholder interests.
Authoritative Geodata and Map Services
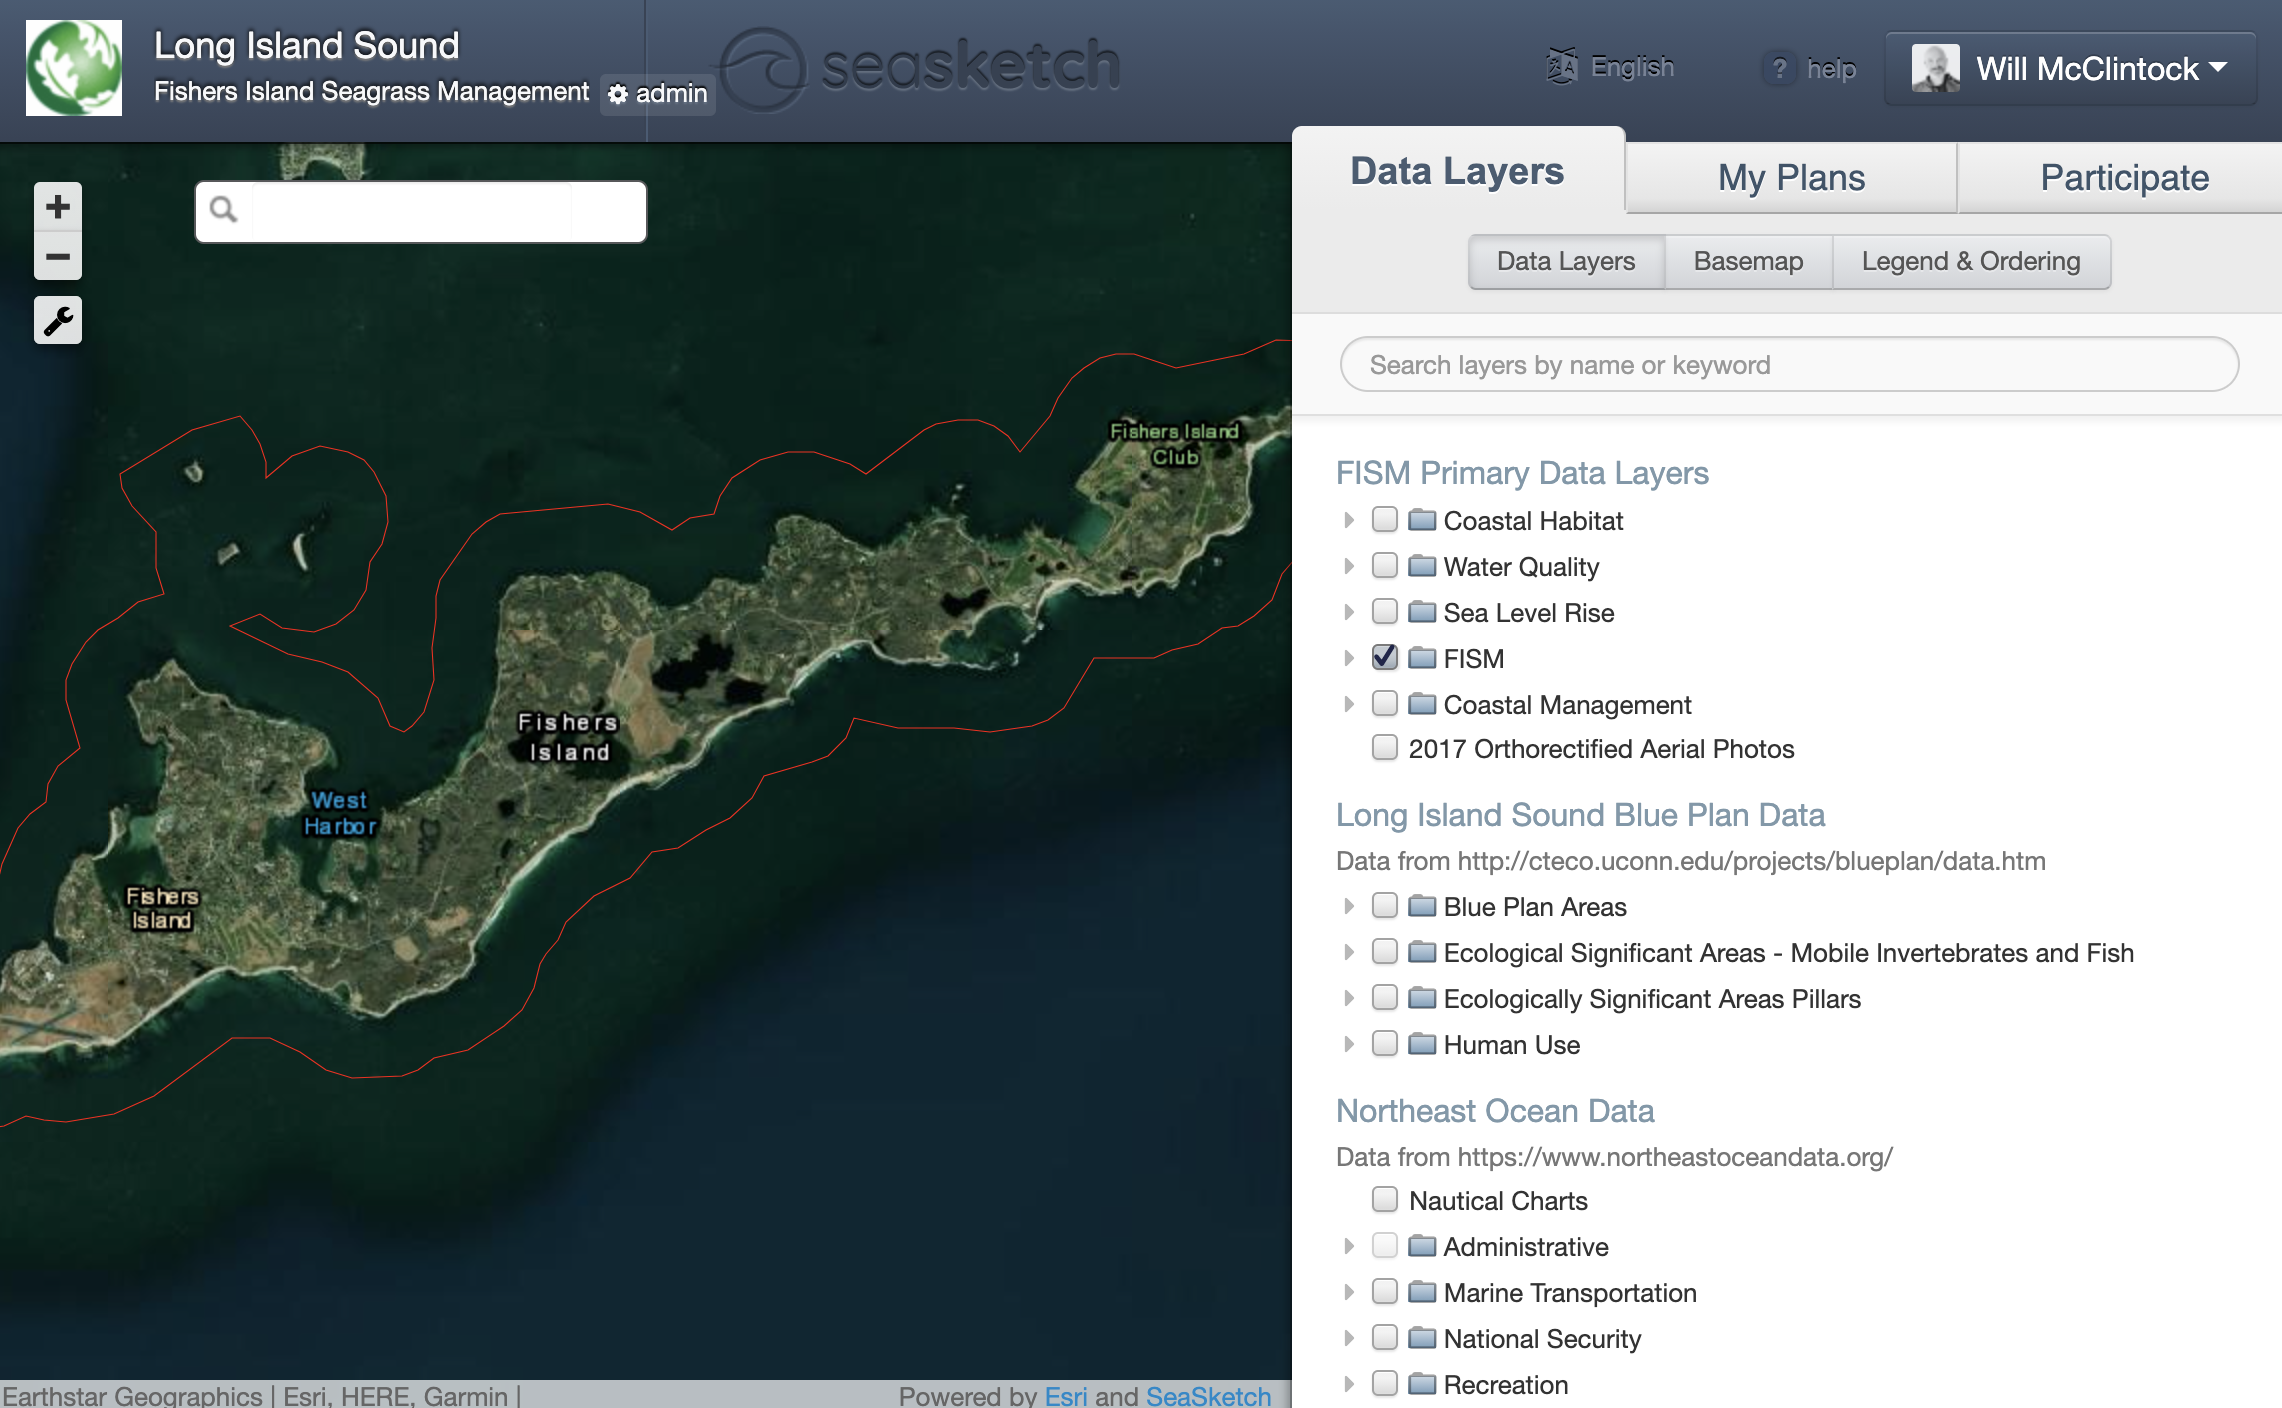
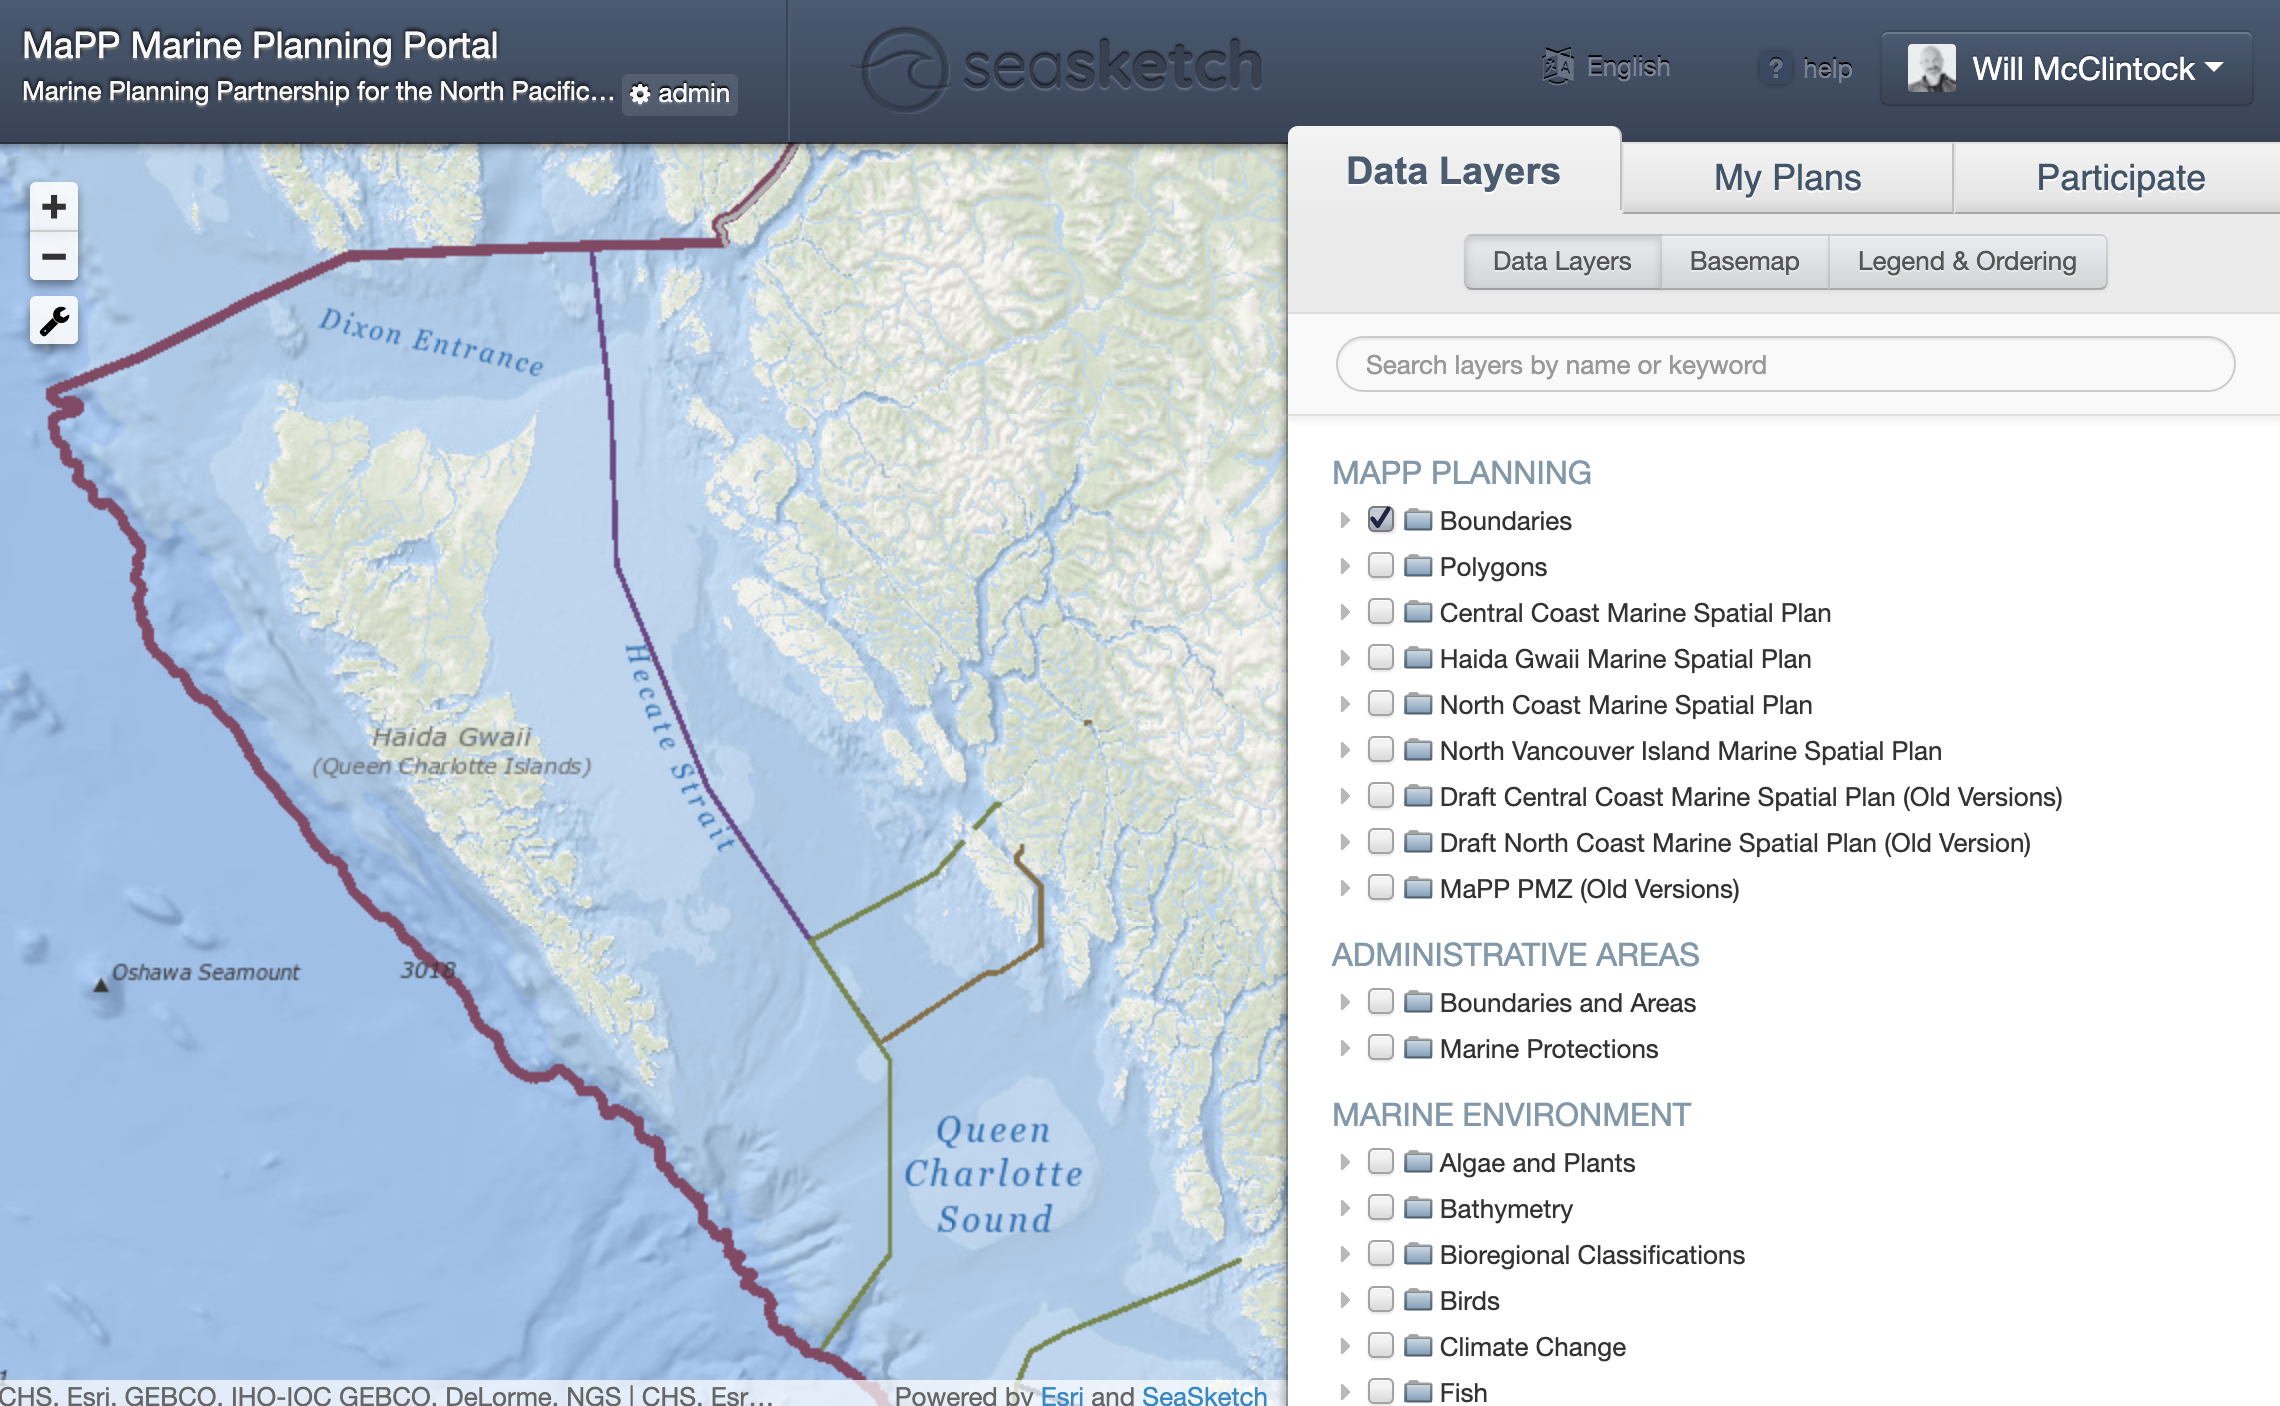
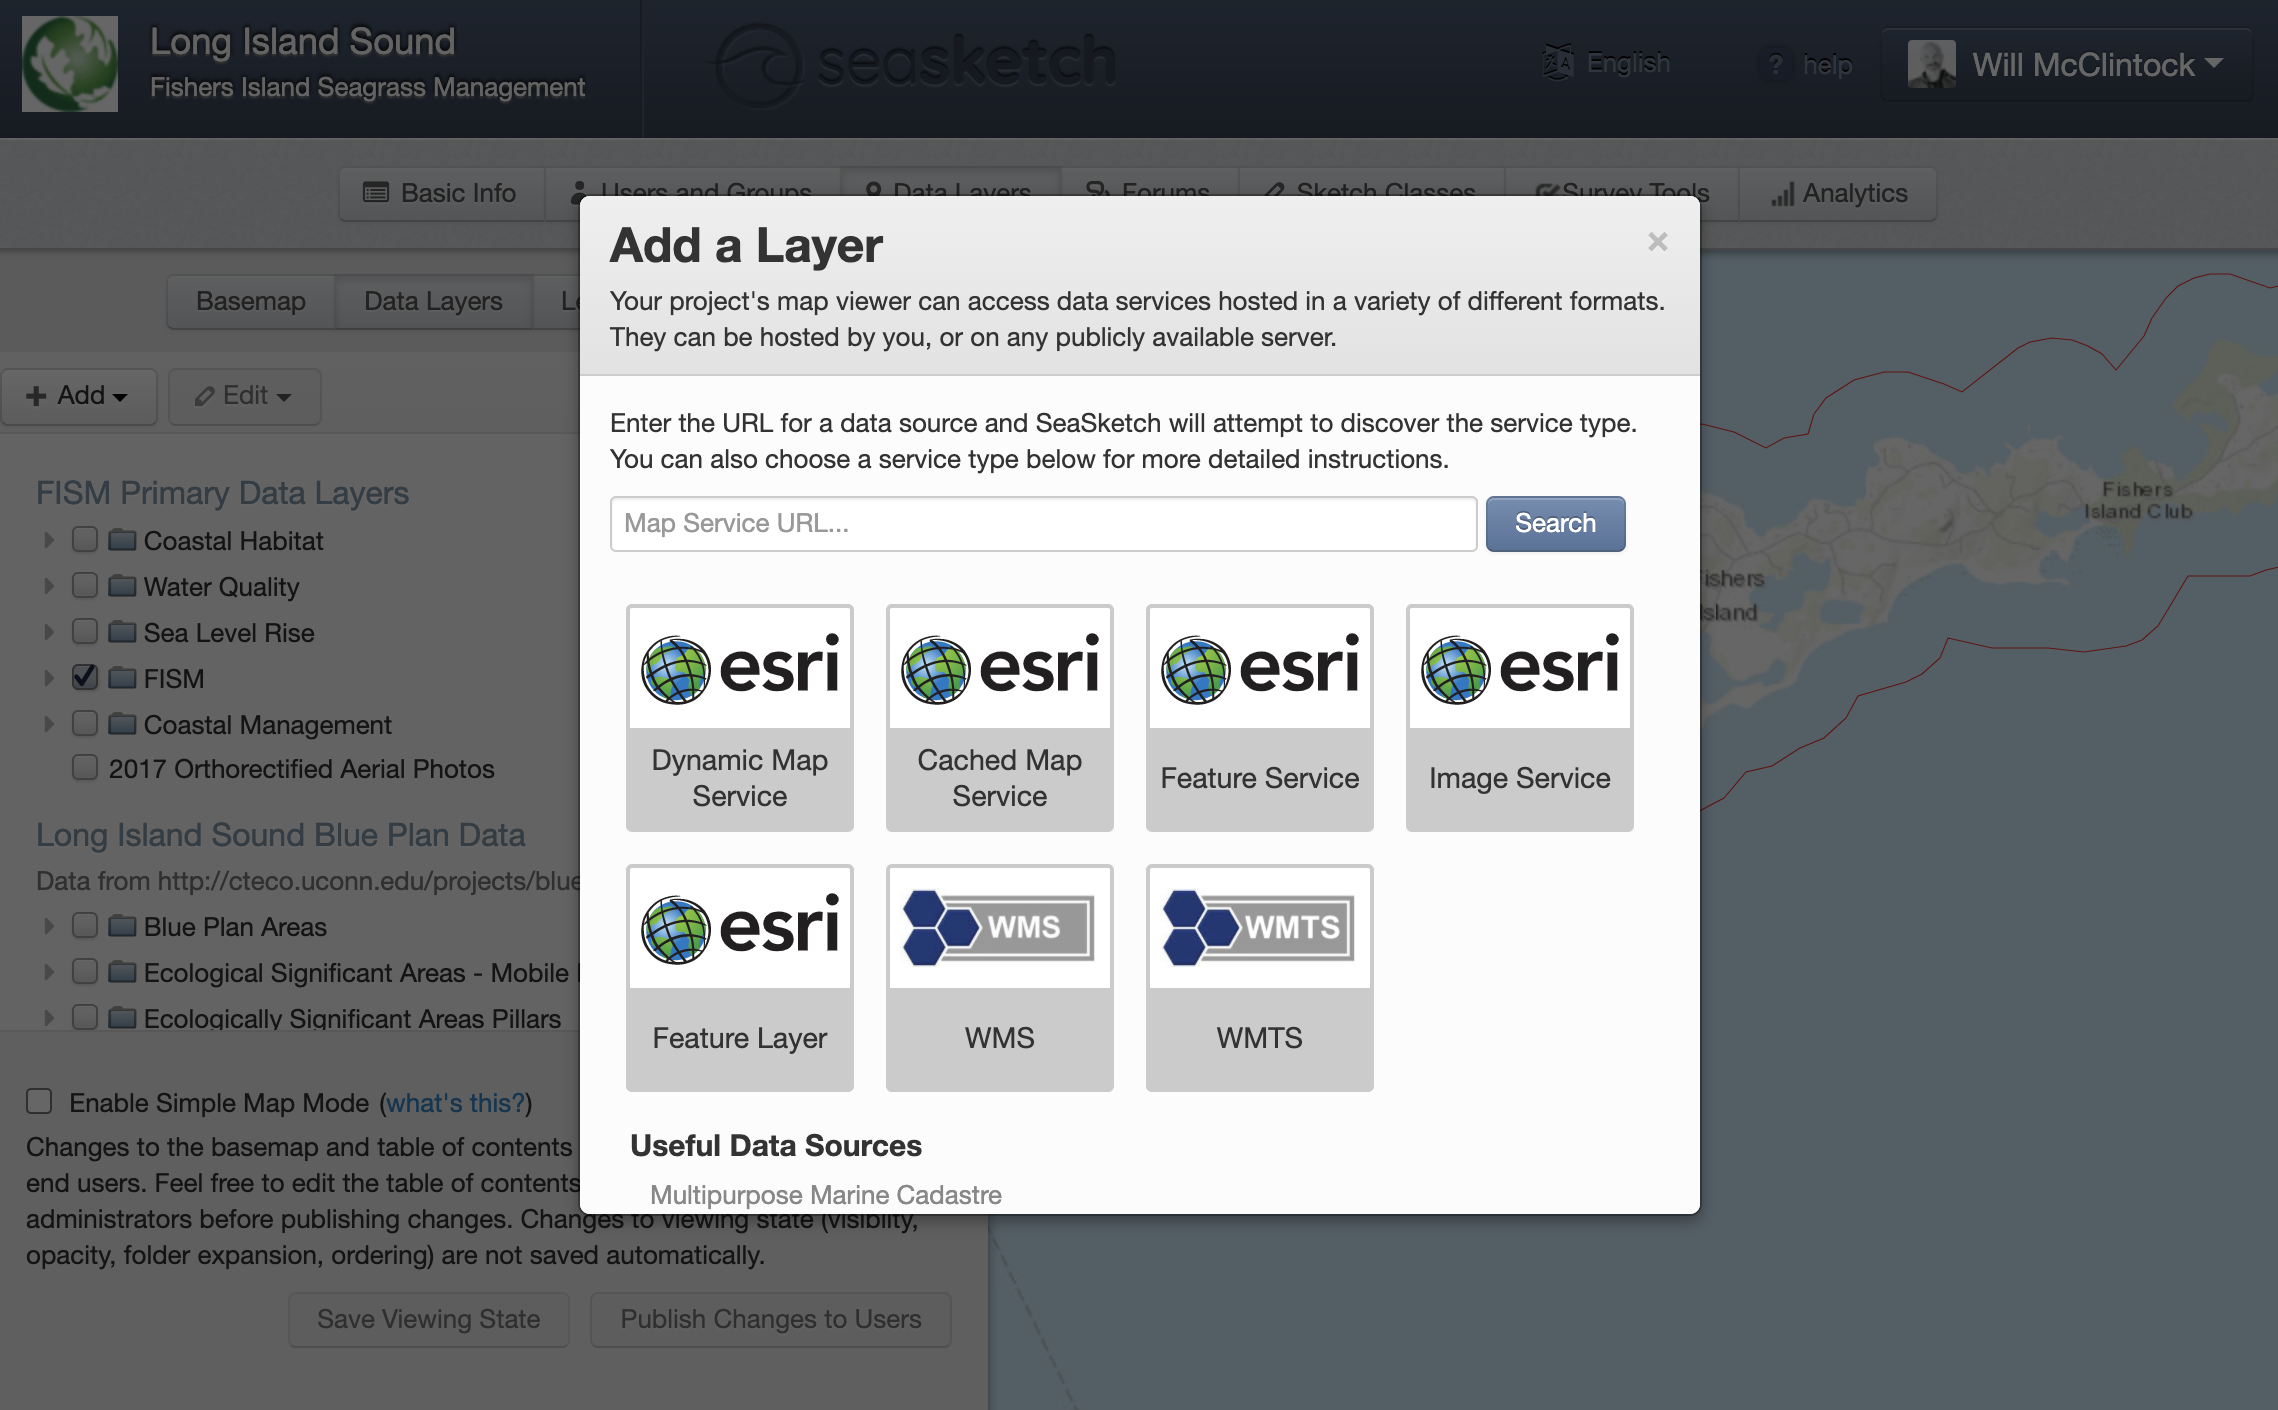
The foundation of any SeaSketch project is geospatial information (maps) displayed as map services. There are no minimum data requirements. You can begin working with whatever you've got. Maps may be published as Esri REST Services (e.g., with ArcGIS Server or ArcGIS online) and open source mapping services (e.g., WMS, WMTS) and then imported into SeaSketch. Example maps include administrative boundaries (e.g., EEZ, territorial sea, existing MPAs), seafloor habitats, bathymetry, human uses, etc.
The maps you choose to include as Data Layers in SeaSketch depend on the goals of your process. If you are planning for marine protected areas, shipping lanes and aquaculture sites, you may want navigational charts, habitat maps, the distribution of fishing activities and other layers that may be used to guide users in the design of their plans. Protected areas are only meaningful if they effectively protect certain habitats, shipping lanes minimize collision and maximize efficiency, aquaculture sites are located in certain depth zones, etc. On a case-by-case basis, you will need to evaluate what data need to be viewed as maps, and what subset of these data need to be analysed.
Enabling factors
In some cases, relevant map data may already be published as map services and discoverable in coastal atlases and other map portals. As long as they are in the correct formats (Esri map services, WMS, WMTS, etc), they may be imported directly into SeaSketch and displayed as map layers.
In many cases, it will be advantageous to publish your own map services for display in SeaSketch. This will give you control over the cartography and performance of the maps.
Lesson learned
Successful projects usually have a single GIS technician who is responsible for locating existing map services, acquiring data from providers (government agencies, NGOs, academics) and generating new map services using standard desktop and web-mapping tools.
SeaSketch Surveys to Assess Ocean Use
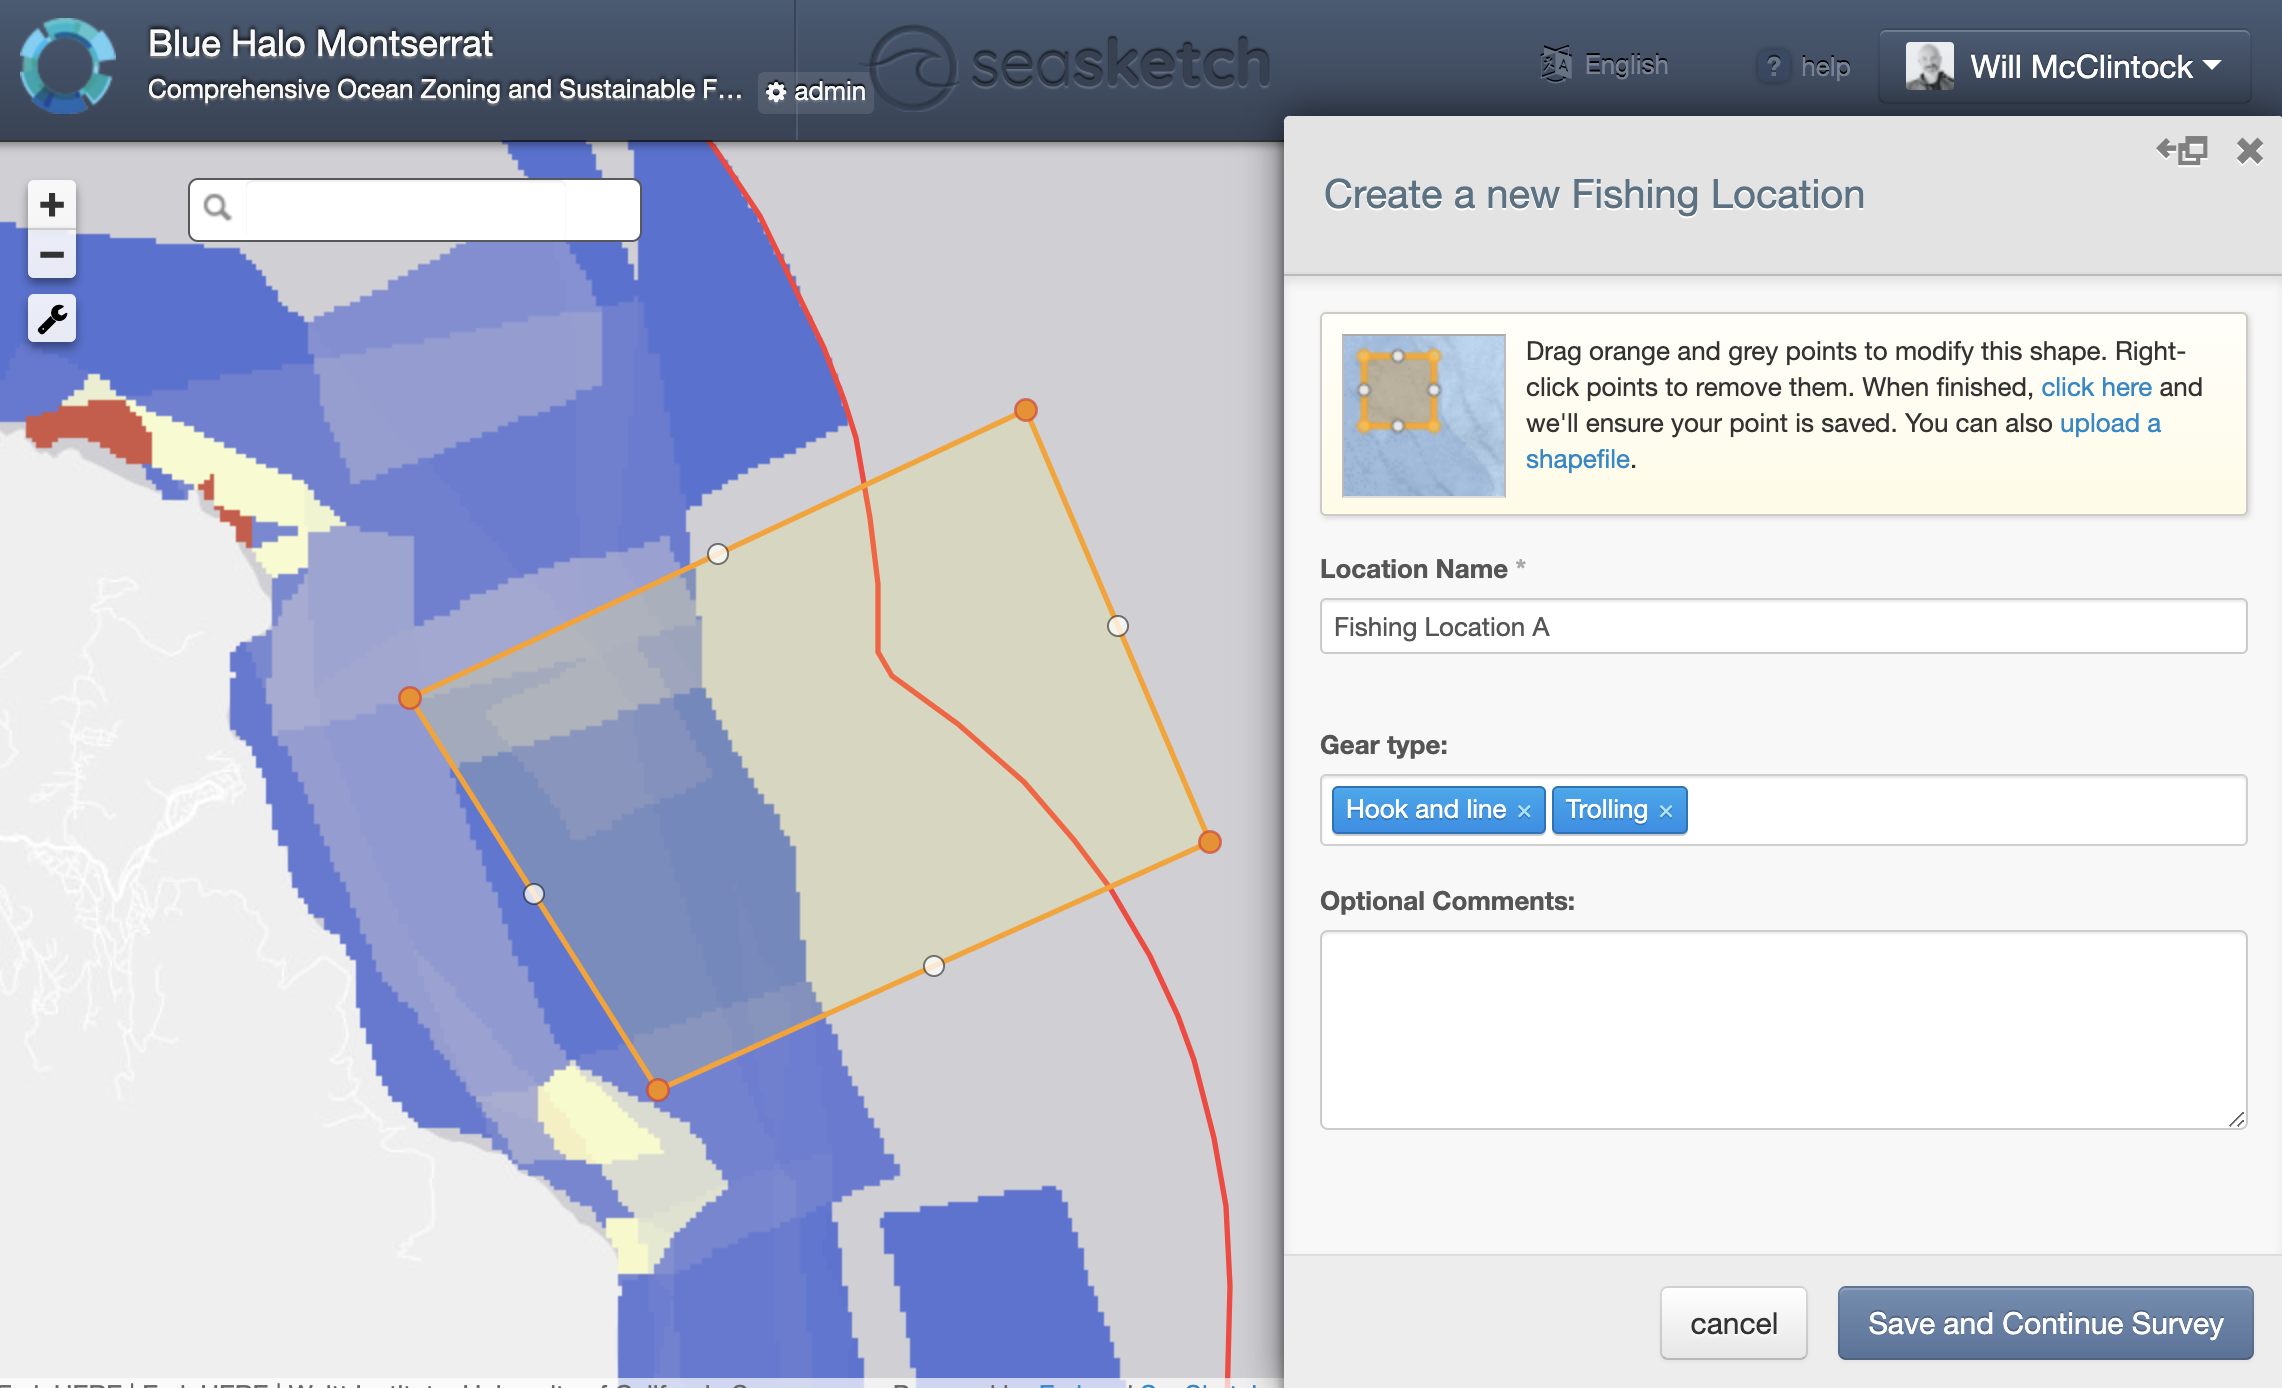
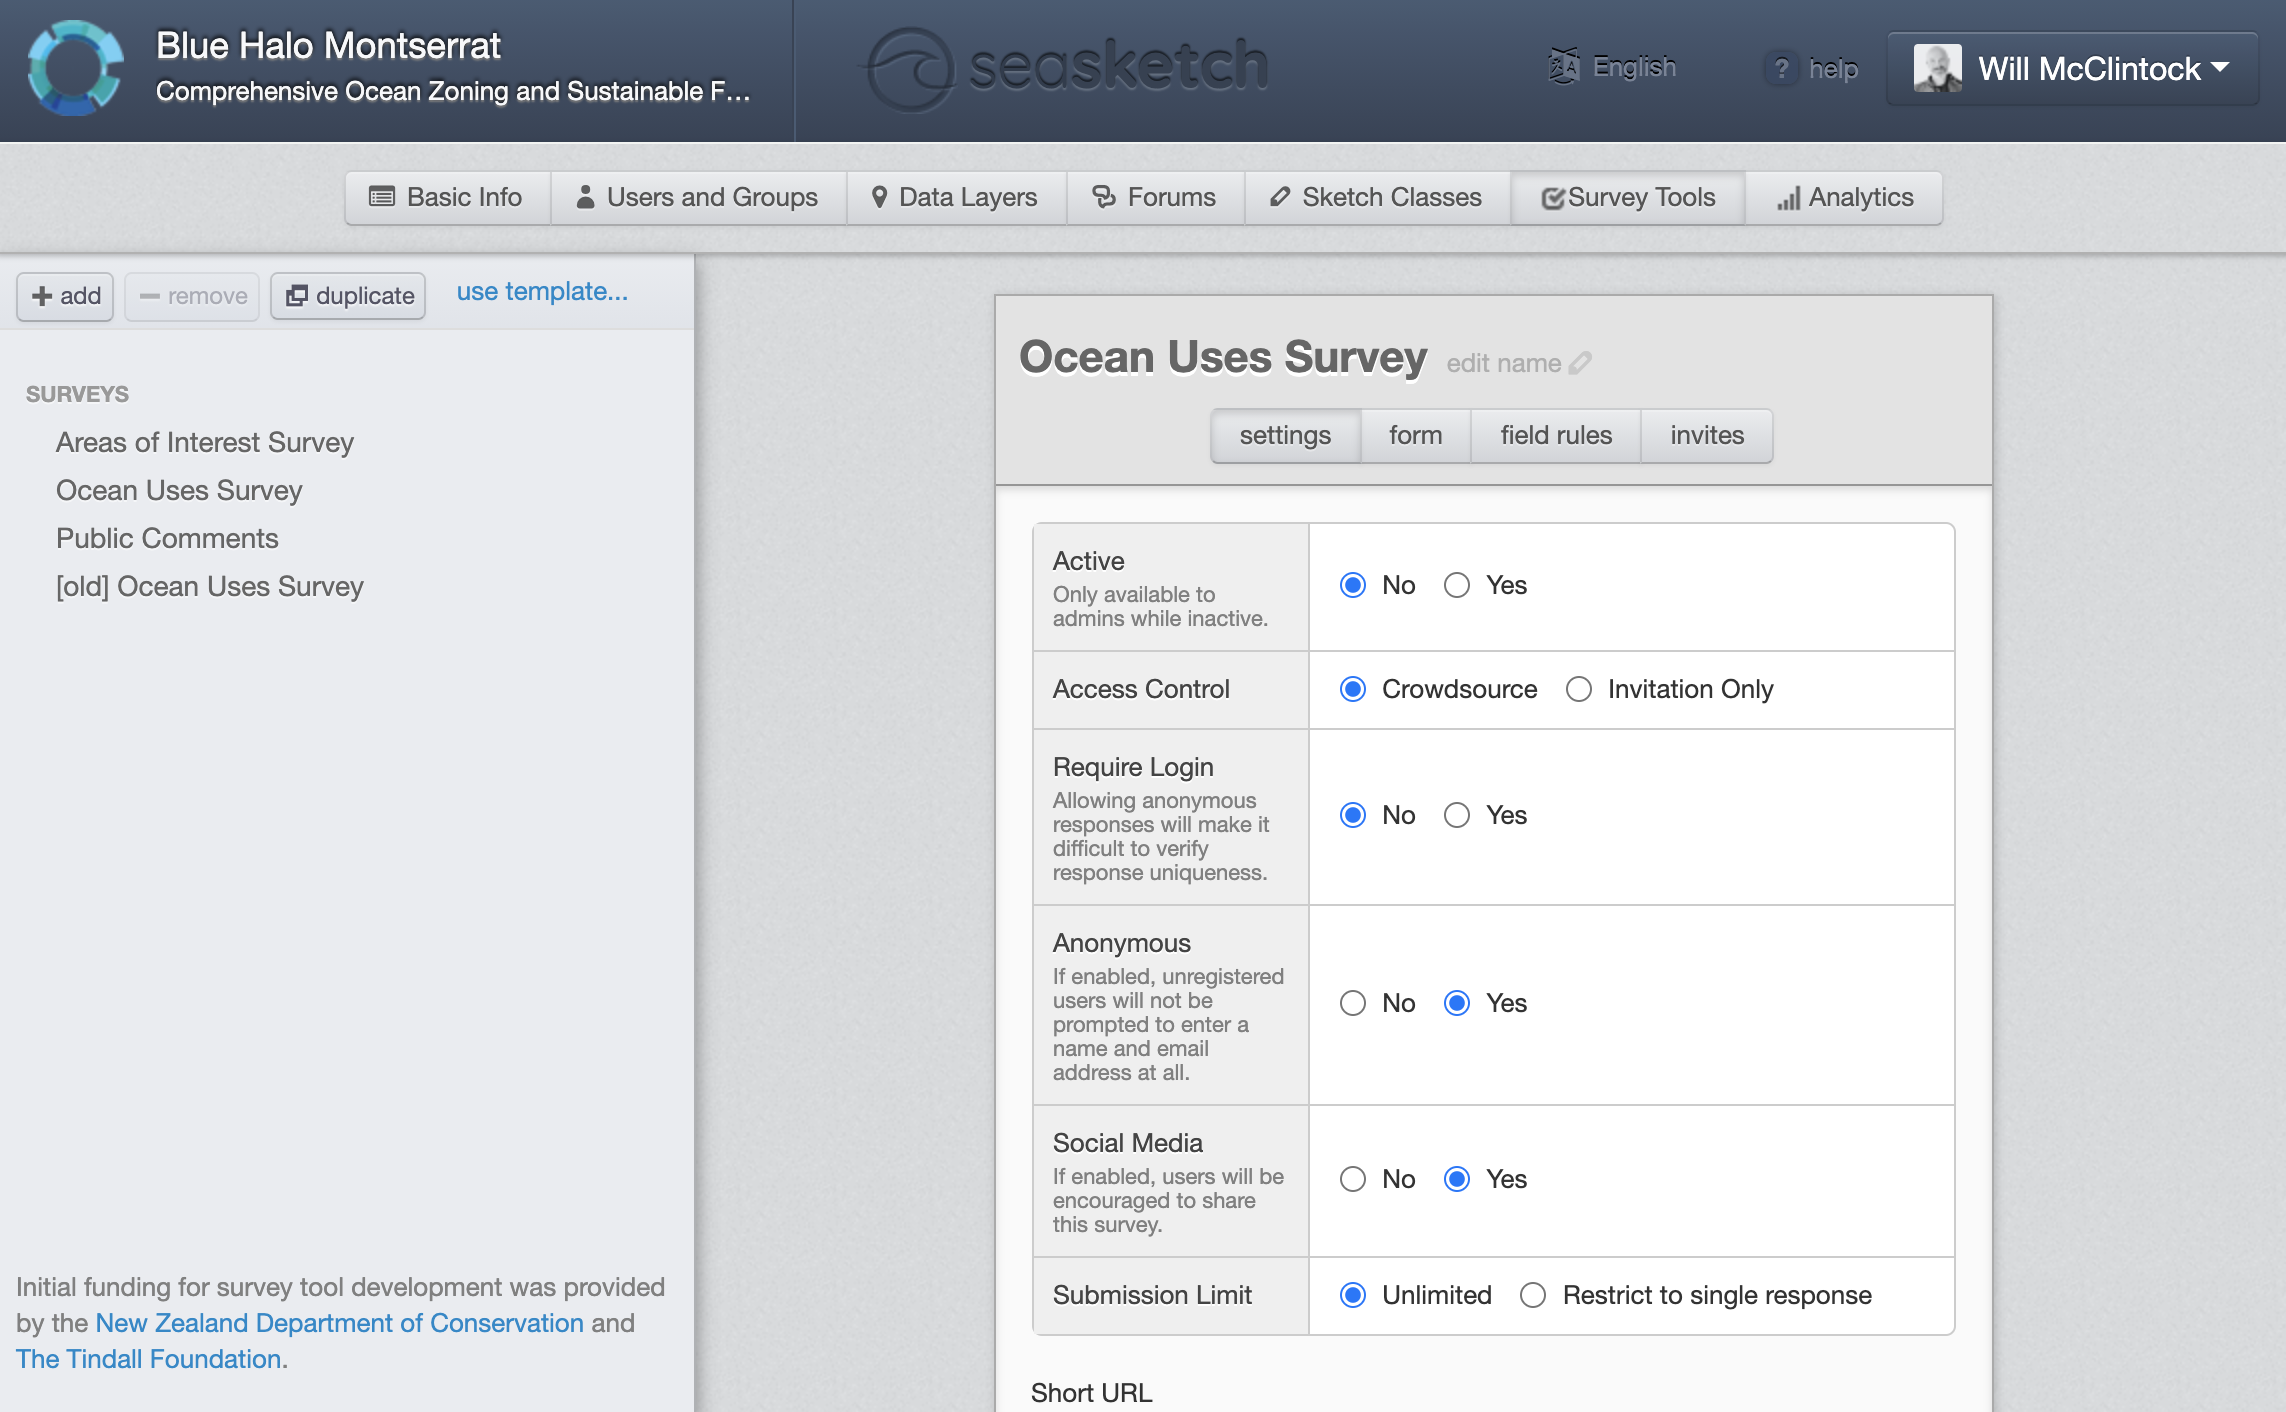
SeaSketch has features to develop and deploy spatial surveys that, for example, ask ocean users to identify valued or important areas (locations important for fishing, shipping, diving, aquaculture, traditional uses, etc.). Survey results may be used to create heatmaps that describe the distribution of valued areas. These results may be visualized (or not) and analysed when users draw prospective ocean zones to understand the potential value and impact of zoning scenarios.
Enabling factors
Currently, SeaSketch surveys only work on a desktop computer with Internet connection. It does not work offline or on mobile devices. (The next version of SeaSketch which will be launched in January 2022 will be compatible with mobile devices. Shortly thereafter it will also work in an offline mode). So, plan on conducting surveys in an Internet-connected environment and using a desktop computer.
In many cases, surveys will require facilitation, particularly when the general population does not have personal computers.
Lesson learned
While it's easy to develop a survey in SeaSketch, it's not always easy to do it from a scientifically defensible perspective. Consider working with a social scientist who can help you create a survey that uses well-established survey techniques.
Consider training a team of survey facilitators that can survey the local populations in person by meeting them at the docks, beach, cafes, institutions, etc. These facilitators should be trained in communicating the structure of the planning process and, in particular, how survey responses will be treated and used in planning.
Keep surveys very simple. The simpler the survey, the higher response rate you can expect. Scientists and planners are often keen on gathering as much information as possible from stakeholders. Resist the temptation to ask more questions that you absolutely need to properly engage stakeholders and do marine spatial planning.
Impacts
Successful planning depends on a commitment from government to maximize stakeholder involvement, including goal-setting, generating and evaluating plans, and decision-making. With this in mind, the SeaSketch platform lowers barriers to participation and provides a means by which stakeholders may concretely offer their ideas and opinions, share information and express their values about how ocean space is managed. Zoning plans that reflect these ideas, values and opinions are more likely to gain social acceptance and therefore stand a greater chance of implementation and compliance.
Moreover, if stakeholders are offered the opportunity use SeaSketch hands-on, they will have a better understanding of the information used in planning as well as the structure of the planning process itself. By viewing maps, sketching and evaluating plans, users gain a deeper appreciation for what is meant by “habitats” or “the distribution of fishing effort”.
And, finally, by using the data and tools available in SeaSketch, users have access to a common language within which they may collaborate and communicate with others. A zone that is labelled “marine protected area” or “no-go zone” has a specific meaning that is reflected in the attributes and reports associated with it. As such, stakeholders are clear about what they want (or don’t want) when they share their ideas.
Beneficiaries
Planners, stakeholders and government agency representatives who are directly involved in marine spatial planning.
Story

Stakeholders in Barbuda use SeaSketch for planning ocean zones.
Will McClintock
SeaSketch was used in the Caribbean island of Barbuda to create a comprehensive marine spatial plan. The Barbuda Council (the island’s governing body), with invited support from the Waitt Institute, navigated complex trade-offs between spatial uses to design and legally codify zoning for their entire marine jurisdiction. After a year of intensive community engagement under this Blue Halo Initiative, regulations were adopted in August 2014 that established zones for sanctuaries, fish net prohibitions, anchoring/mooring, and shipping. Key data used included a habitat map and a heatmap of fishing value. Barbudans designed all zones, with technical support, using SeaSketch. Throughout the process, the Council incorporated input from fishers and other community members, seeking a final zoning design that would minimize negative impacts on livelihoods and earn broad community support. The final zoning plan balances economic, conservation, and cultural uses. It includes thirteen zones and meets the pre-agreed goals of protecting one-third of the waters overall and approximately one-third of each habitat type. The consultation process included seven community consultation meetings, five fisher consultation meetings, and two meetings of a stakeholder committee. The initiative is now in the implementation phase, however Hurricane Irma devastated Barbuda in September 2017, creating substantial challenges for ongoing implementation.
At the beginning of the Blue Halo Initiative, there was some doubt that stakeholders would be able to identify on a map where they fished – an important step that show the distribution of valued fishing areas to be avoided as no-take zones. Indeed, some who had fished around the island had never looked at a navigational map or a detailed map of the coastline. It was quite common for initiative staff and partners to sit for twenty minutes or so with individual stakeholders to look at the maps in SeaSketch and orient them to their fishing areas. In all cases, stakeholders were eventually able to orient themselves and identify the areas where they fished. In most cases, we found that facilitated discussions (e.g., interviews) were the easiest way to engage stakeholders, even those that had personal computers with Internet access. Although SeaSketch is quite easy to use, it may require 10-15 minutes of training and, more importantly, a specific motivation to use the tool in a participatory process.