Showcasing key results through a simplified and interactive storytelling tool
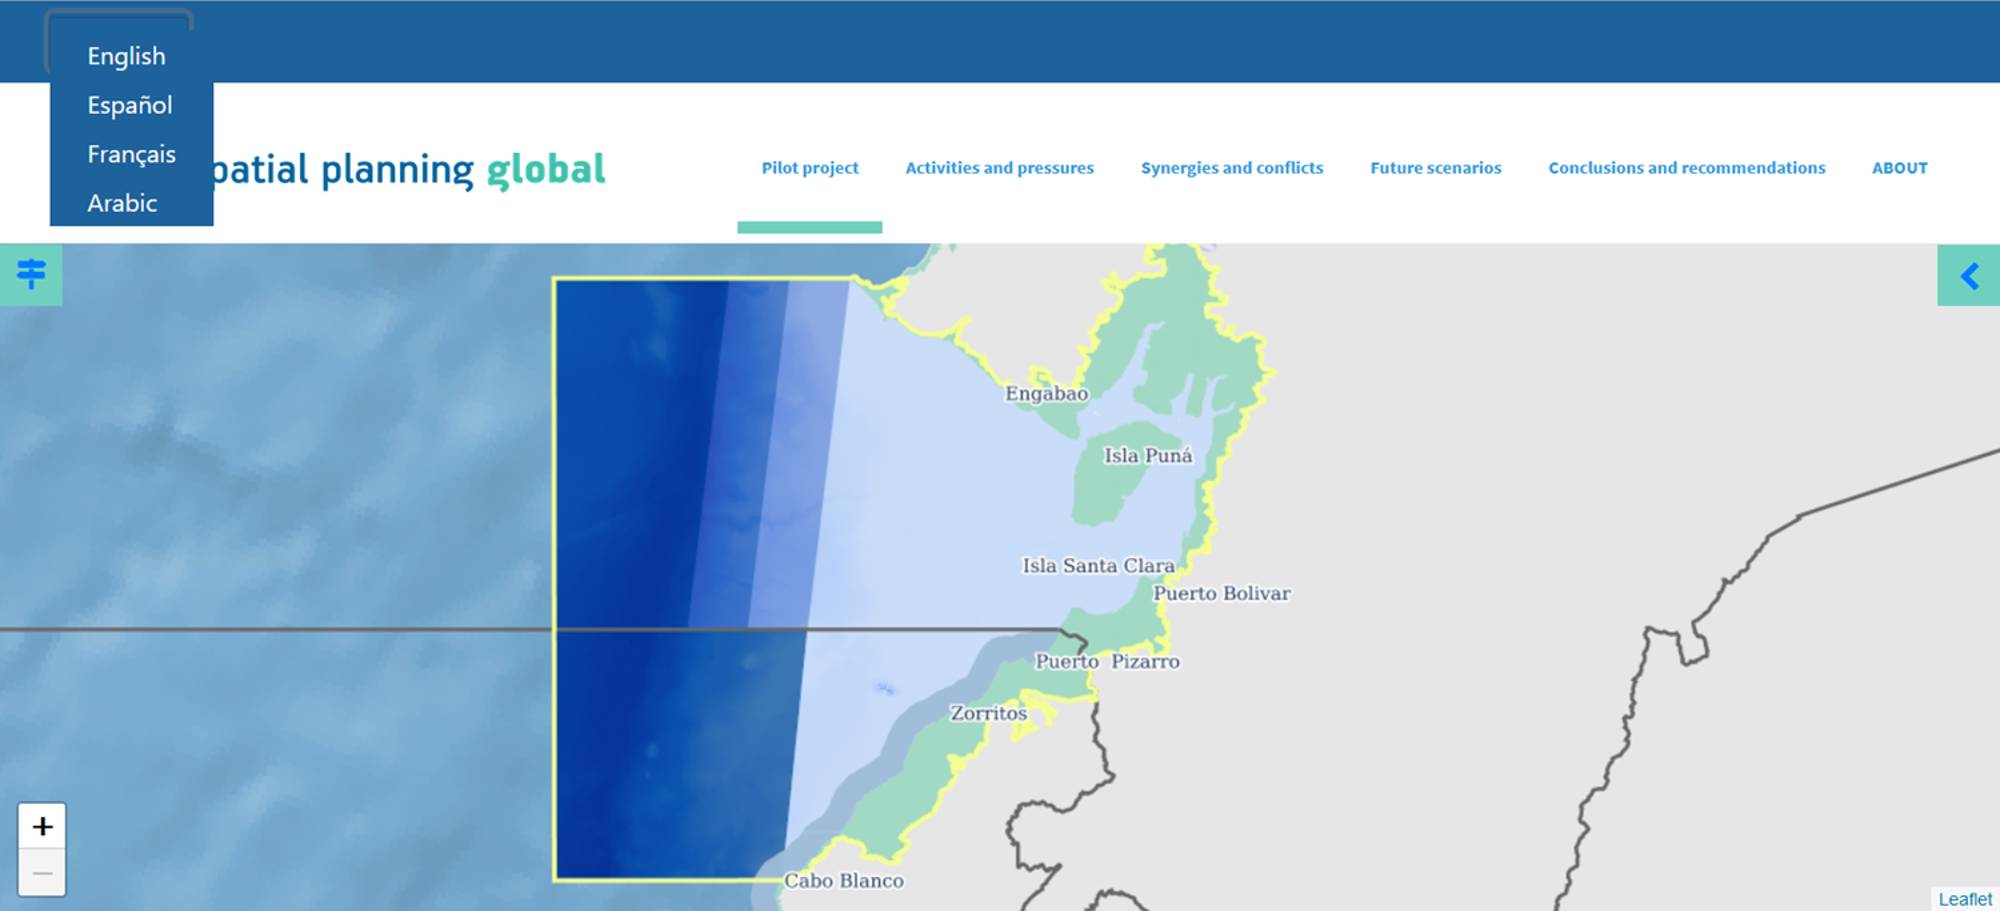
Storytelling tool about the Gulf of Guayaquil: tab about the pilot project.
MSPglobal, IOC-UNESCO
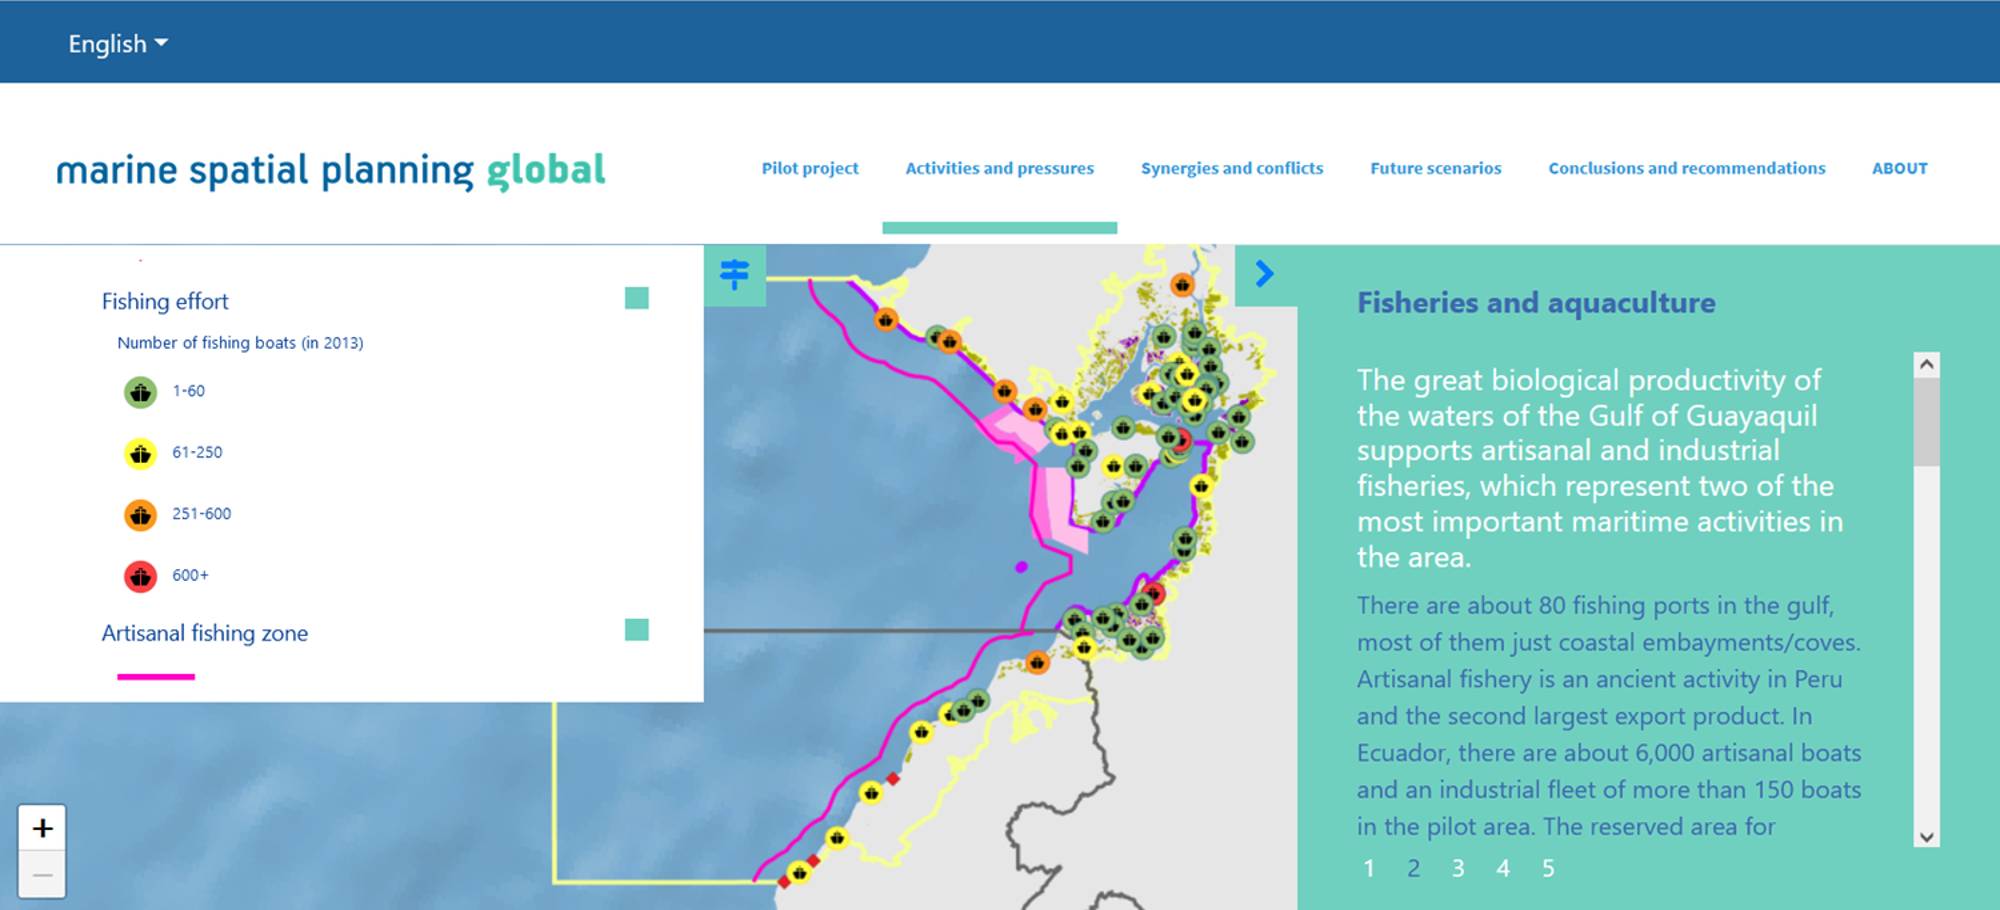
Storytelling tool about the Gulf of Guayaquil: tab about activities and pressures.
MSPglobal, IOC-UNESCO
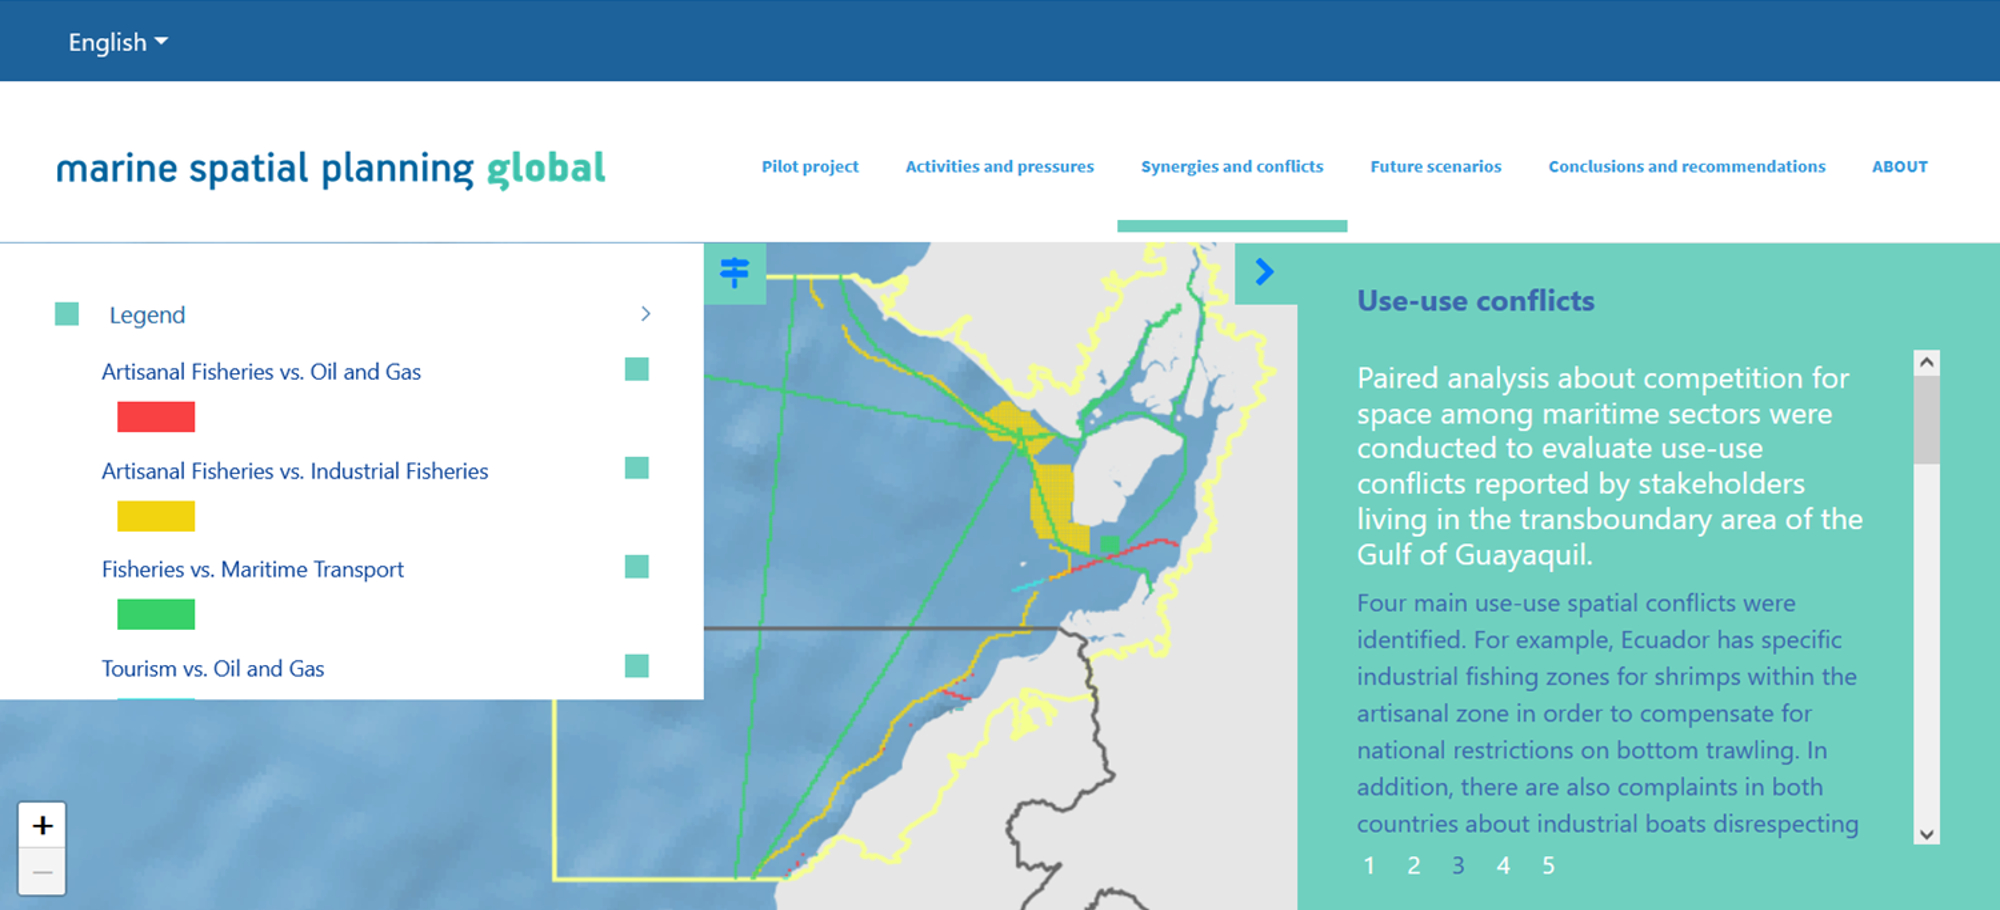
Storytelling tool about the Gulf of Guayaquil: tab about synergies and conflicts.
MSPglobal, IOC-UNESCO
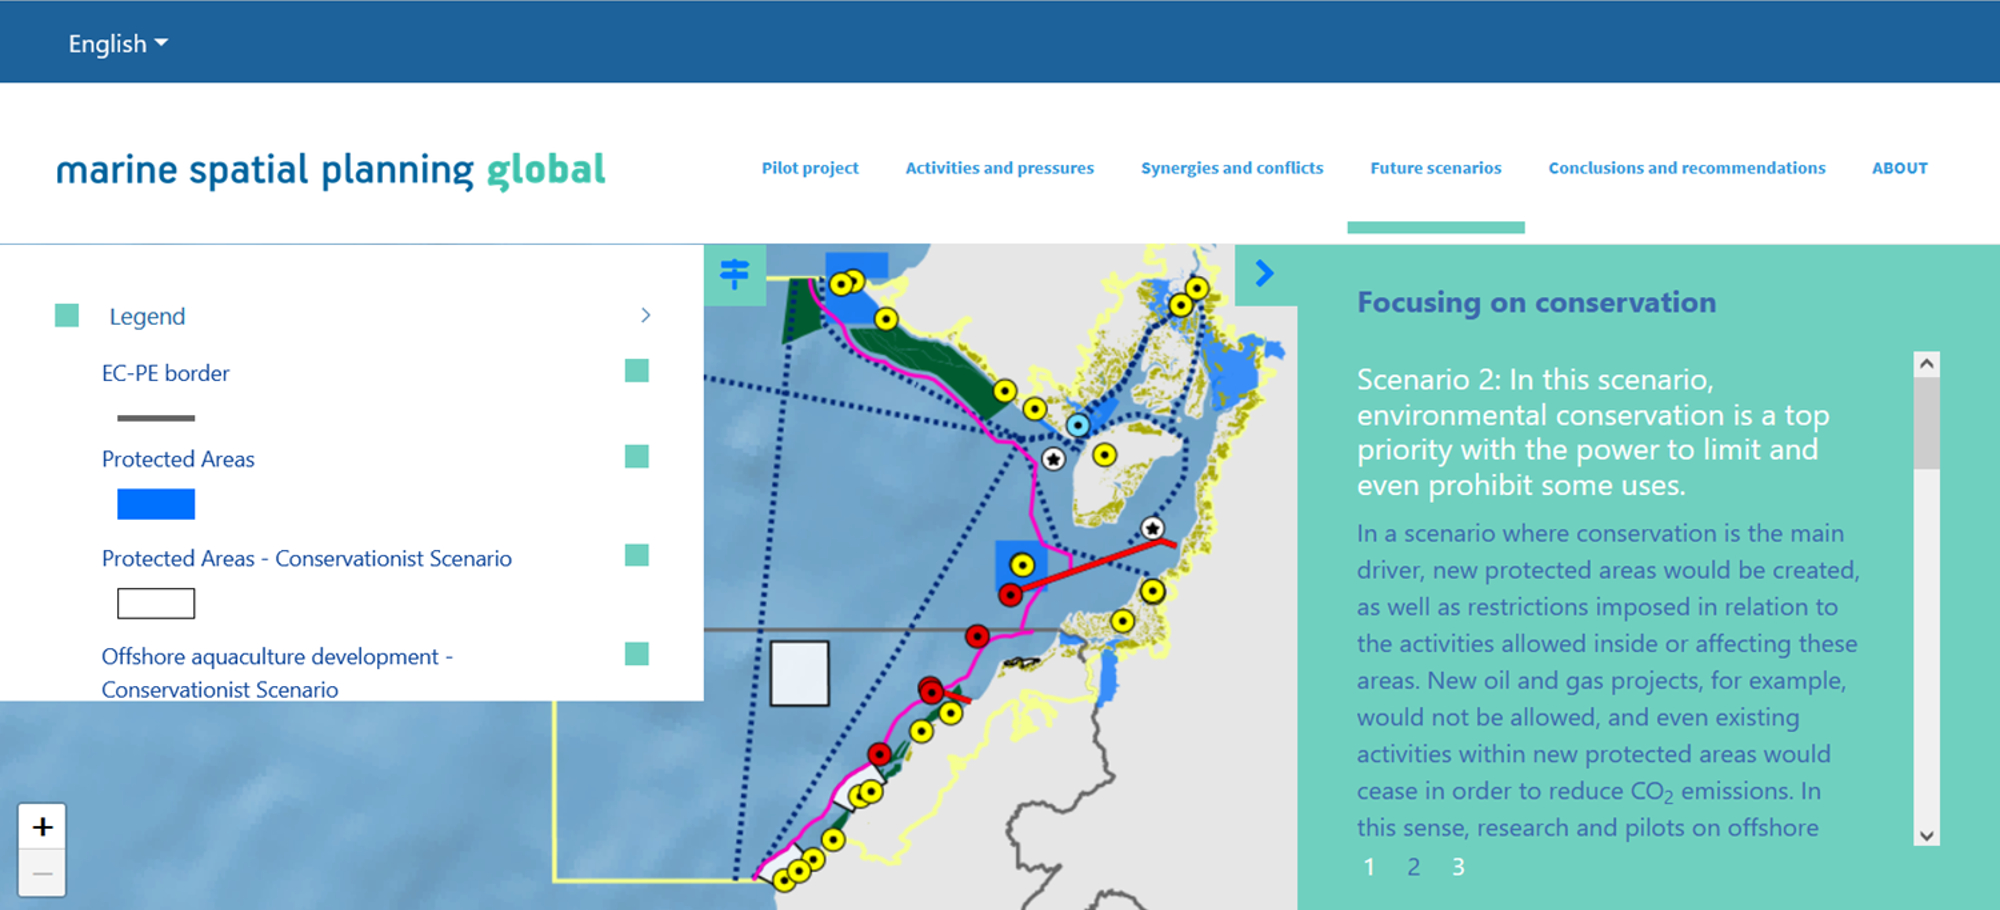
Storytelling tool about the Gulf of Guayaquil: tab about future scenarios.
MSPglobal, IOC-UNESCO
This Building Block aimed to develop a multilingual storytelling tool to showcase both existing conditions and scenarios for the pilot in the Gulf of Guayaquil. The objective was to present the data and information in a simplified and interactive way, and as such to turn complex concepts into notions easily understood by all stakeholders.
- Professionals with previous experience in developing an online storytelling tool with spatial data visualization
- Technical reports with the necessary data and information published in advance
- Spatial data organized in a geodatabase with metadata
- Teamwork: Those involved in the development of the reports need to work in close collaboration with those responsible for developing the tool to ensure that the key results are properly selected and displayed
- Structure: Organize the story through different themes, titles, taglines and sections
- Be concise: Limit the size of the texts to the key messages. If the user is interested in learning more, reports with the full information should be available
- Technical terms: Whenever possible, avoid using difficult and/or technical language (including acronyms) that might be incomprehensible for a wider audience. If it cannot be avoided, better to add the meaning
- Responsive web tool: Depending on the type and format of the content, it might be difficult to ensure that the tool is sufficiently responsive across different internet browsers, resolutions and electronic devices
- Beta version: It is recommended to develop a beta version (pre-release) and then ask some users to play with it before the launch


