Cartographie et évaluation des services écosystémiques pour une gestion intégrée
Les services écosystémiques ont été cartographiés et évalués dans le cadre d'un processus participatif qui comprenait la conception de scénarios spatialement explicites des utilisations humaines futures dans toute la zone côtière du Belize. Pour comprendre les implications des différents scénarios de développement, l'équipe a utilisé les modèles InVEST pour cartographier la valeur future des services de protection côtière, de loisirs et de pêche. Le plan qui en résulte peut aider les habitants du Belize à suivre une voie plus sage pour gérer les ressources incroyablement précieuses que leur océan et leur côte leur procurent.
Contexte
Défis à relever
- Utilisations multiples et concurrentes dans les zones côtières
- Absence de planification intégrée
- Manque de données spatiales et d'outils pour créer le premier plan national de gestion intégrée des zones côtières du pays
Emplacement
Traiter
Résumé du processus
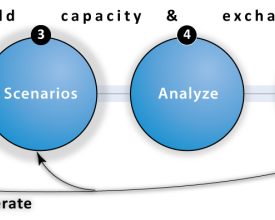
Ces trois éléments illustrent le processus scientifique et politique mis en œuvre au Belize. Ce processus met l'accent sur l'engagement itératif des parties prenantes, l'avancement de la science pour répondre aux besoins politiques et le renforcement des capacités à travers six étapes générales : (1) définir la portée du processus, (2) collecter et compiler les données, (3) élaborer des scénarios, (4) analyser les services écosystémiques, (5) synthétiser les résultats et (6) communiquer les connaissances.
Blocs de construction
Comités consultatifs multisectoriels
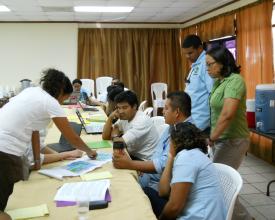
Les comités consultatifs côtiers représentent un éventail de secteurs et de parties prenantes qui se réunissent régulièrement pour formuler des recommandations à l'Autorité et à l'Institut de gestion des zones côtières (CZMAI). L'examen public du projet de plan permet d'obtenir un large engagement. La CZMAI recueille des informations sur les valeurs des parties prenantes et, en collaboration avec NatCap, les combine avec des données et des cartes sur la répartition actuelle et future plausible des utilisations, des prévisions économiques et des plans gouvernementaux existants. Le résultat est un ensemble de scénarios futurs reflétant les contributions des parties prenantes.
Facteurs favorables
- Organisation de réunions régulières et de consultations publiques.
- Diversité des membres (universitaires, fonctionnaires, planificateurs, scientifiques, ONG, etc.)
- Partager tous les comptes rendus de réunions, y compris les procès-verbaux et les annotations de cartes, et les utiliser comme base pour un plan de travail.
Leçon apprise
- Les membres des comités consultatifs multisectoriels apprécient d'être inclus dans le processus et de pouvoir exprimer leurs préoccupations et leur vision de l'avenir.
- L'organisation de réunions de comités consultatifs multisectoriels est coûteuse car elle nécessite de couvrir les frais d'hébergement, de repas et de transport des participants.
- La période d'examen public au cours de laquelle les citoyens ont pu faire part de leurs commentaires sur le projet de plan a été très utile.
Élaboration de scénarios
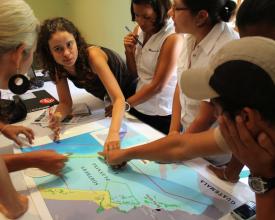
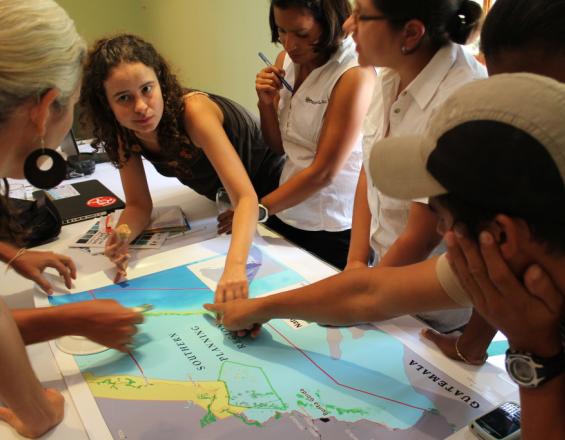
Trois scénarios futurs sont élaborés avec l'aide des parties prenantes qui fournissent des informations locales sur les utilisations humaines et les préférences en matière de localisation et d'intensité futures. Les parties prenantes suggèrent également des changements spécifiques aux scénarios, sur la base de plans de développement alternatifs connus ou d'utilisations futures des ressources naturelles. Des outils simples (par exemple l'outil de cartographie en ligne InSEAM de NatCap) et des exercices aident les parties prenantes à comprendre ce que sont les scénarios et comment les décisions alternatives en matière de développement spatial peuvent affecter le capital naturel et les avantages offerts aux populations.
Facteurs favorables
- Équipe interdisciplinaire, comprenant un planificateur, un analyste SIG, un écologiste et un spécialiste des sciences sociales/politiques, chargée d'organiser les réunions et d'encourager le retour d'informations de la part des parties prenantes.
- Collecte d'informations spatiales à l'aide de cartes et de prises de notes.
Leçon apprise
- L'élaboration de scénarios est un processus long et itératif qui nécessite plusieurs étapes de révision et d'affinage.
- Il est essentiel d'apporter des cartes et d'autres informations de référence aux réunions afin de stimuler une discussion solide.
Ressources
Synthèse - Communiquer les informations sur les services écosystémiques
La synthèse permet de s'assurer que les résultats de l'analyse des services écosystémiques informent directement la planification et les politiques sur le terrain. Nous illustrons ici comment différents scénarios d'utilisation humaine dans la zone côtière affectent les moyens de subsistance et les bénéfices que les gens tirent de la nature. Il s'agit notamment d'identifier les domaines dans lesquels des mesures incitatives en faveur des services écosystémiques et des politiques gouvernementales pourraient être mises en œuvre afin de soutenir un plan durable pour l'avenir. L'objectif est de maximiser les opportunités économiques et de minimiser la dégradation de l'environnement. L'Autorité et l'Institut de gestion de la zone côtière du Belize ont utilisé divers moyens pour communiquer les résultats, notamment des rapports, des résumés, des documents évalués par des pairs, des présentations et des cartes interactives, tous adaptés aux publics visés.
Facteurs favorables
- Il est essentiel d'obtenir et d'utiliser correctement les données pour compléter les résultats générés par l'évaluation des scénarios.
Leçon apprise
- La sélection et la quantification des paramètres qui trouvent un écho auprès des décideurs peuvent constituer l'étape la plus difficile.
- La synthèse est la plus réussie lorsqu'elle traduit les informations sur les résultats des services écosystémiques en recommandations utiles et spécifiques pour la gestion et les politiques, au moyen de conclusions claires et d'histoires captivantes.
Impacts
- Faire progresser la gestion et la conservation des environnements côtiers et marins, et prendre en compte de manière explicite les bénéfices de la nature pour l'homme
- Associe l'engagement des parties prenantes à des modèles scientifiques de services écosystémiques et les met à la disposition des décideurs politiques.
- Les résultats du modèle suggèrent un rendement plus élevé des services écosystémiques que les décisions de développement ad hoc.
Bénéficiaires
- propriétaires de terres côtières
- pêcheurs
- le secteur industriel et touristique
- les populations indigènes
Objectifs de développement durable
Histoire
La cartographie fait la différence au Belize Gregg Verutes, analyste SIG au WWF : En tant qu'expert en cartographie SIG, je m'attends à ce que mes cartes travaillent dans l'ombre. Les représentations multicouches que je construis pour illustrer la façon dont nous utilisons et valorisons la nature informent généralement les scientifiques, les praticiens et les décideurs politiques. Il est rare qu'elles figurent en bonne place dans les émissions télévisées consacrées à la mise en place d'une politique énergétique nationale durable. C'est pourtant ce qui s'est passé récemment au Belize. Une simple carte que j'ai réalisée à l'instigation d'un guide touristique a contribué à faire échouer une proposition visant à intensifier le forage pétrolier en mer. Notre équipe se trouvait au Belize pour une formation, mais l'ouragan Rina nous a contraints à l'annuler. J'ai profité du temps libre pour visiter les ruines mayas. Alors que nous roulions en jeep sur une route sinueuse, mon guide Carlos s'est enquis de ma profession. J'ai expliqué que je traduisais les données relatives aux impacts environnementaux potentiels de l'utilisation des ressources naturelles en représentations visuelles de la manière dont la nature profite aux gens. "Il m'a demandé : "Oh, vous faites donc des cartes ? "Oui, en gros. Son visage s'est animé d'une excitation que je vois rarement lorsqu'on parle de SIG. "Vous savez ce qui serait génial ? Faire une carte de la marée noire dans le golfe du Mexique et la placer au-dessus du Belize ! "Les gens se disputent au sujet des forages pétroliers autour du Belize. Cela permettrait de montrer ce qui est en jeu si une catastrophe similaire se produisait ici". C'était l'un de ces moments d'illumination. En tant que cartographe, j'ai une idée assez précise de la taille relative des différents pays et étendues d'eau, mais la carte que j'ai créée m'a surpris moi-même. Je savais que la marée noire paraîtrait importante par rapport au Belize, mais j'ai été surpris de voir à quel point la tache noire couvrait son littoral. La carte montrait comment une marée noire d'une telle ampleur au large des côtes du Belize dévasterait le pays. Près de la moitié des Béliziens vivent de la côte, que ce soit de la pêche, du tourisme ou d'autres activités liées à l'océan. J'ai envoyé la carte à une organisation appelée Healthy Reefs for Healthy people Initiative, qui a commencé à intégrer l'image dans des panneaux et des publicités télévisées incitant les gens à voter "non" lors du prochain référendum populaire. Au final, plus de 90 % des Béliziens ont voté contre l'exploration et le forage pétroliers en mer. La carte a été réalisée à l'aide d'une technologie de pointe, mais n'a pas besoin d'être expliquée. Cette image saisissante montre de manière frappante à quel point la nature est précieuse pour la santé et le bien-être de la population. Et ces personnes ont pris des mesures pour protéger l'écosystème dont elles dépendent. Qu'est-ce qu'un modeste cartographe peut demander de plus ?
