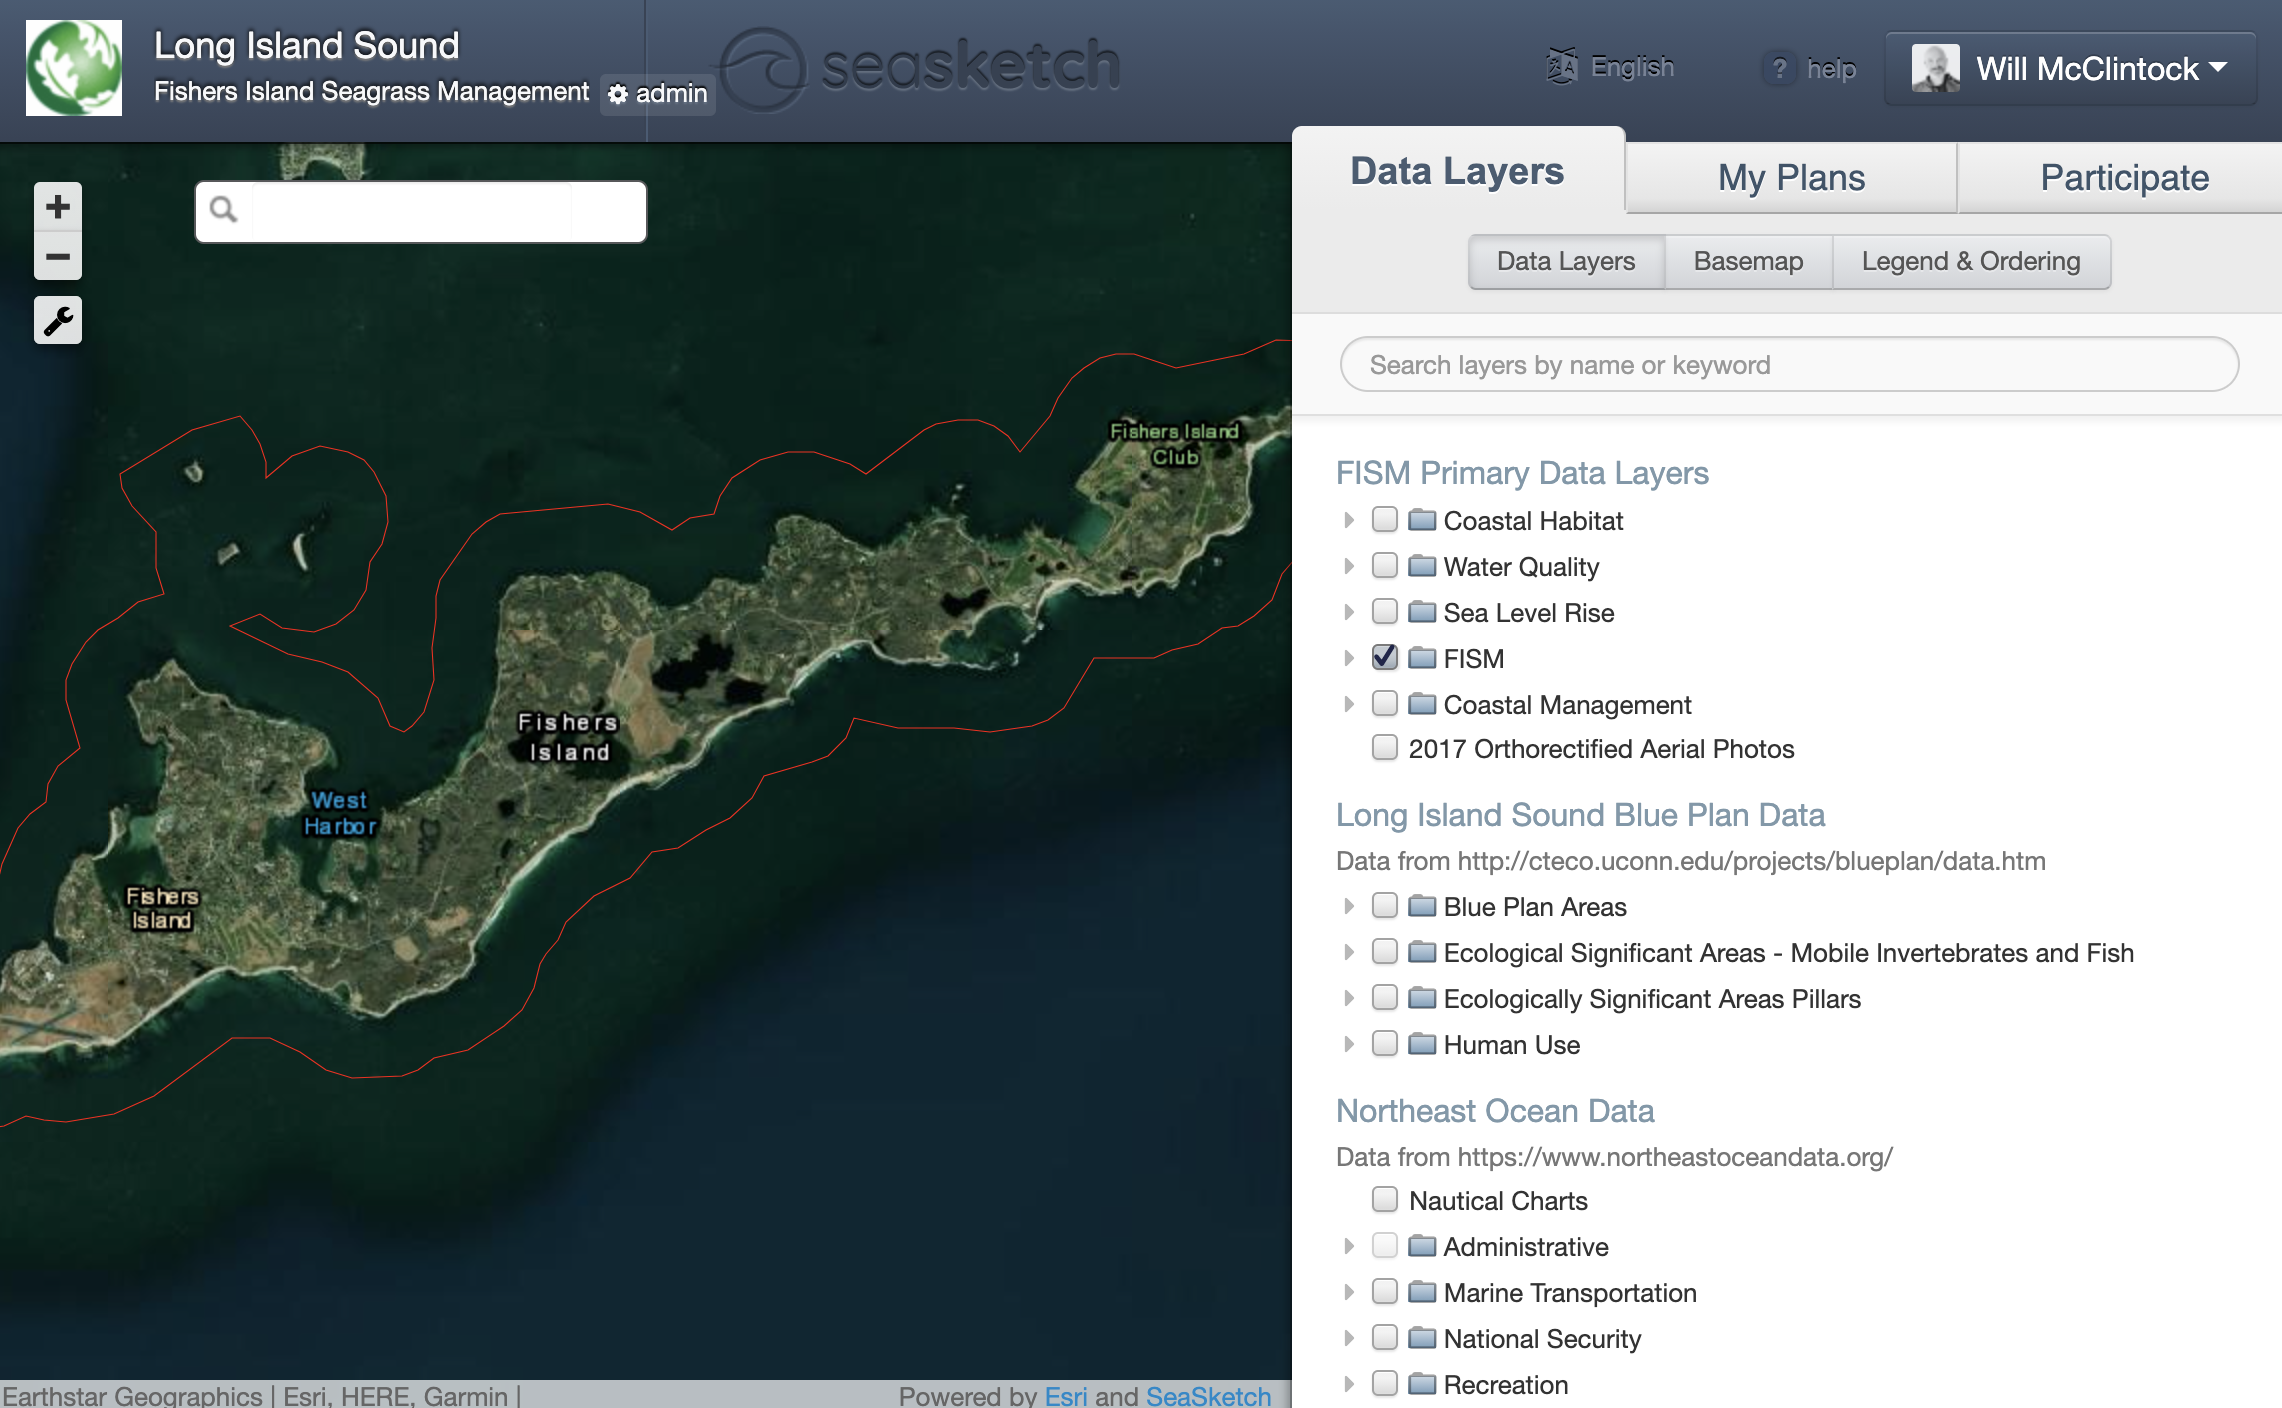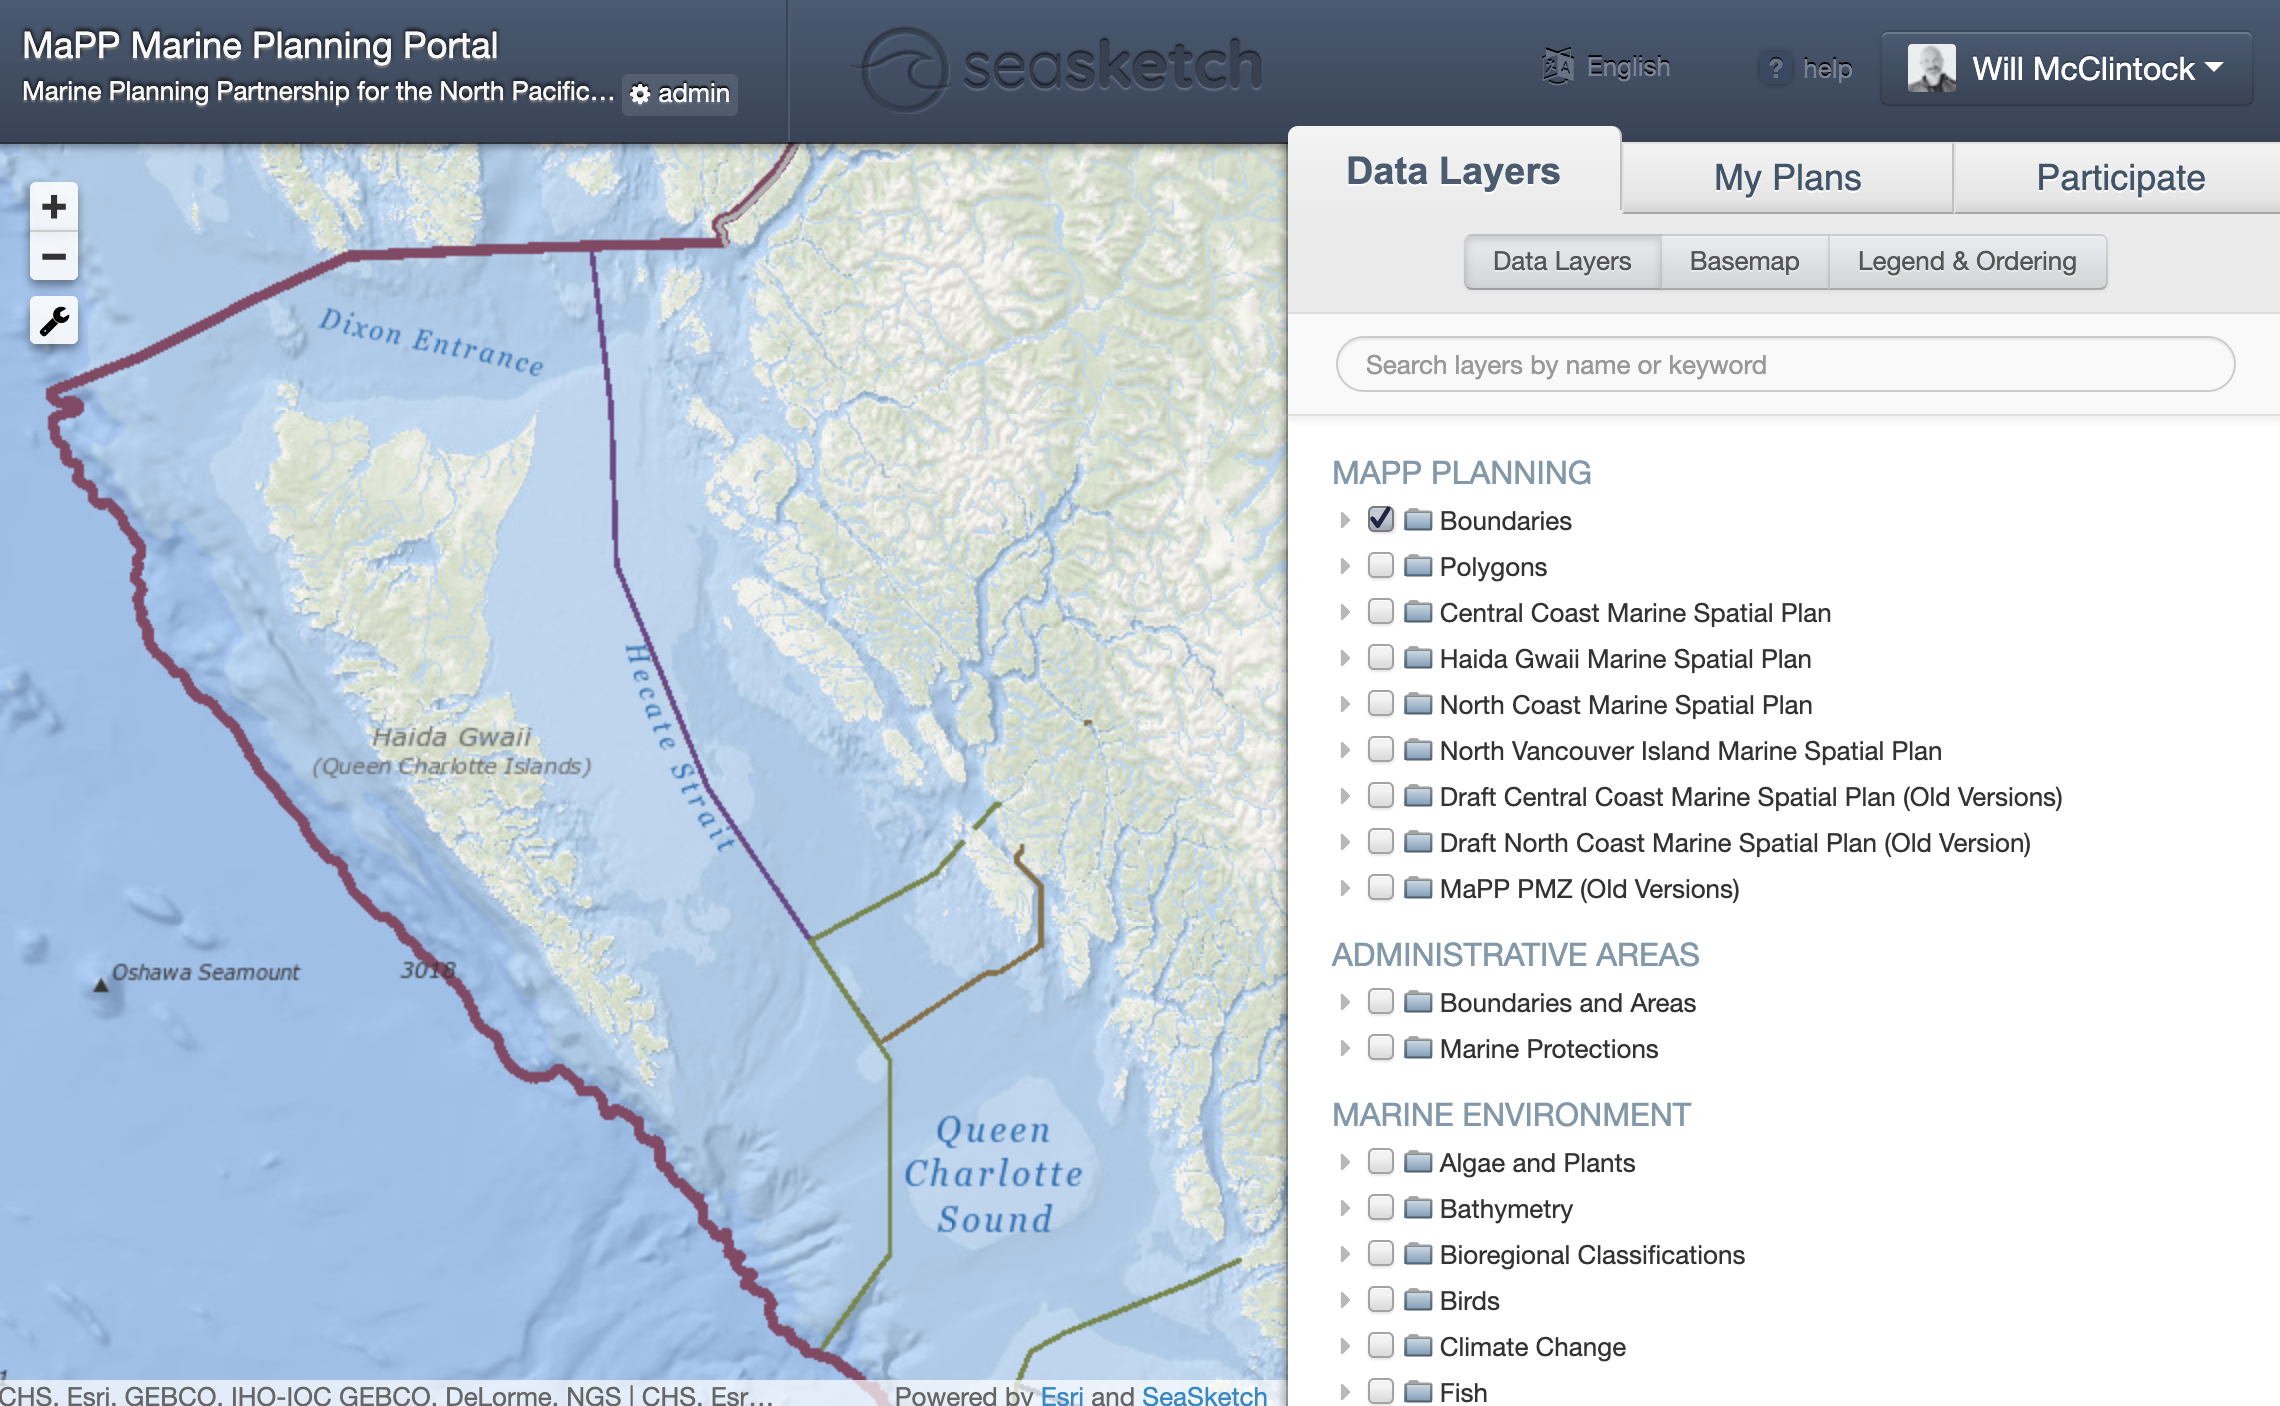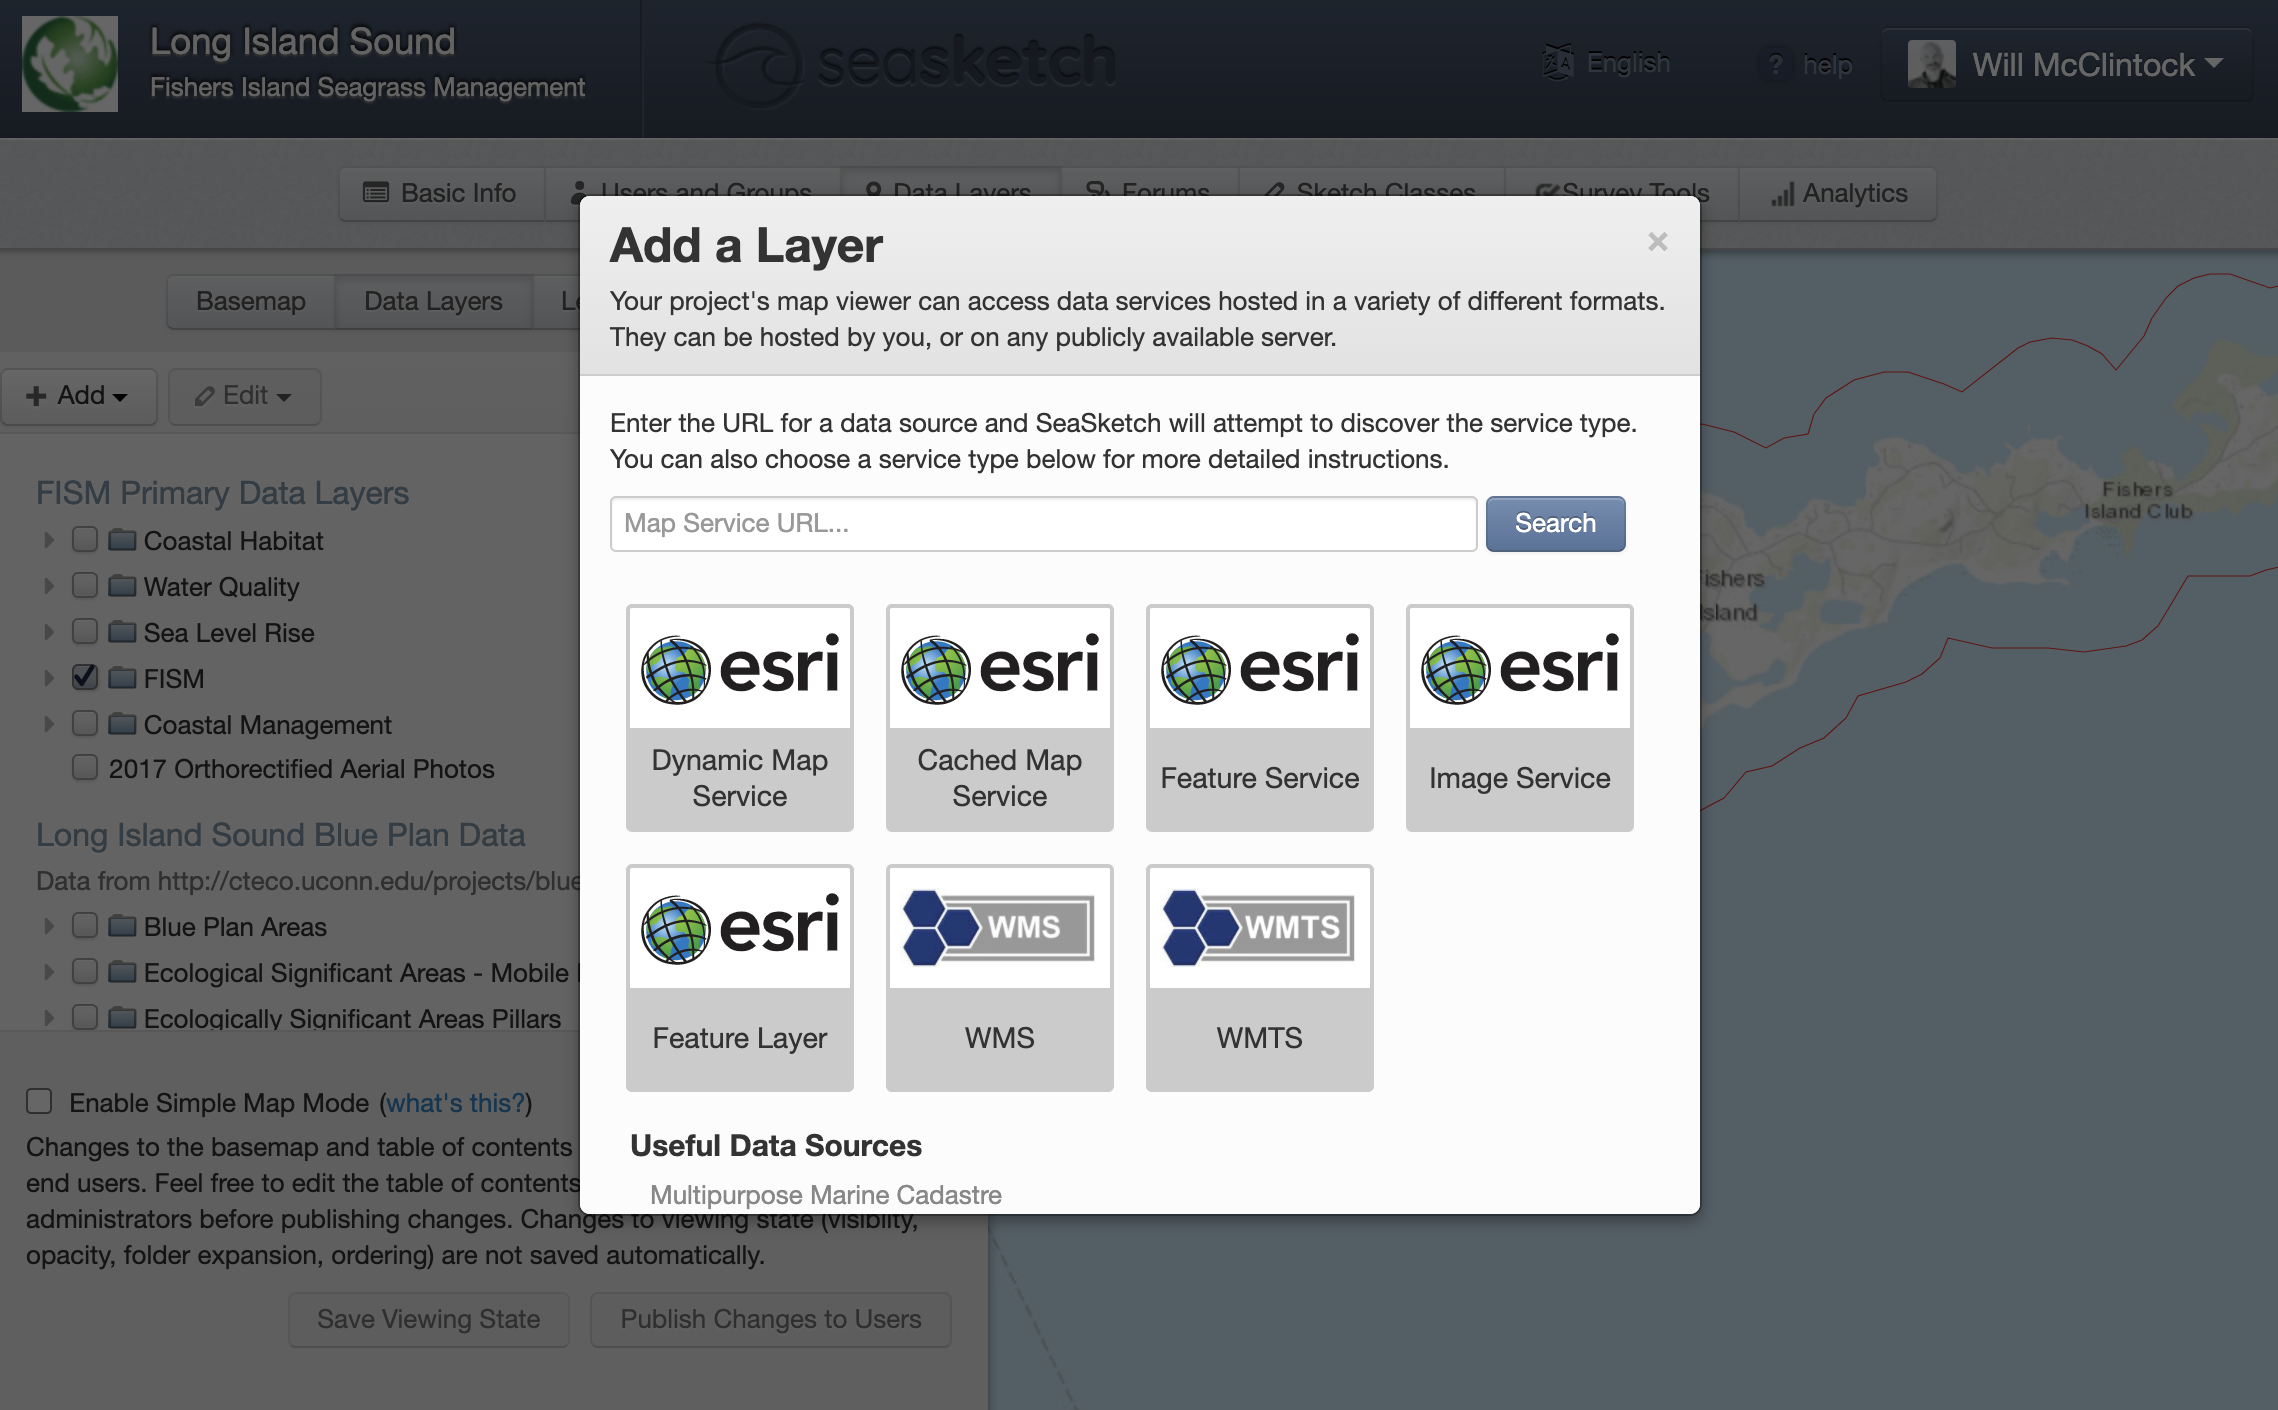


La base de tout projet SeaSketch est constituée d'informations géospatiales (cartes) affichées sous forme de services cartographiques. Il n'y a pas d'exigences minimales en matière de données. Vous pouvez commencer à travailler avec ce que vous avez. Les cartes peuvent être publiées sous forme de services Esri REST (par exemple, avec ArcGIS Server ou ArcGIS online) et de services cartographiques open source (par exemple, WMS, WMTS), puis importées dans SeaSketch. Les exemples de cartes comprennent les limites administratives (par exemple, ZEE, mer territoriale, AMP existantes), les habitats des fonds marins, la bathymétrie, les utilisations humaines, etc.
Les cartes que vous choisissez d'inclure en tant que couches de données dans SeaSketch dépendent des objectifs de votre processus. Si vous planifiez des zones marines protégées, des couloirs de navigation et des sites d'aquaculture, vous voudrez peut-être des cartes de navigation, des cartes d'habitat, la répartition des activités de pêche et d'autres couches qui peuvent être utilisées pour guider les utilisateurs dans la conception de leurs plans. Les zones protégées n'ont de sens que si elles protègent efficacement certains habitats, les couloirs de navigation minimisent les collisions et maximisent l'efficacité, les sites d'aquaculture sont situés dans certaines zones de profondeur, etc. Au cas par cas, vous devrez évaluer quelles données doivent être visualisées sous forme de cartes et quel sous-ensemble de ces données doit être analysé.
Dans certains cas, les données cartographiques pertinentes peuvent déjà être publiées en tant que services cartographiques et être accessibles dans les atlas côtiers et autres portails cartographiques. Tant qu'elles sont dans les bons formats (services cartographiques Esri, WMS, WMTS, etc.), elles peuvent être importées directement dans SeaSketch et affichées en tant que couches cartographiques.
Dans de nombreux cas, il sera avantageux de publier vos propres services cartographiques pour les afficher dans SeaSketch. Cela vous permettra de contrôler la cartographie et la performance des cartes.
Les projets réussis disposent généralement d'un seul technicien SIG chargé de localiser les services cartographiques existants, d'acquérir des données auprès des fournisseurs (agences gouvernementales, ONG, universitaires) et de générer de nouveaux services cartographiques à l'aide d'outils de cartographie de bureau et de cartographie Web standard.