Geospatial and emissions modeling
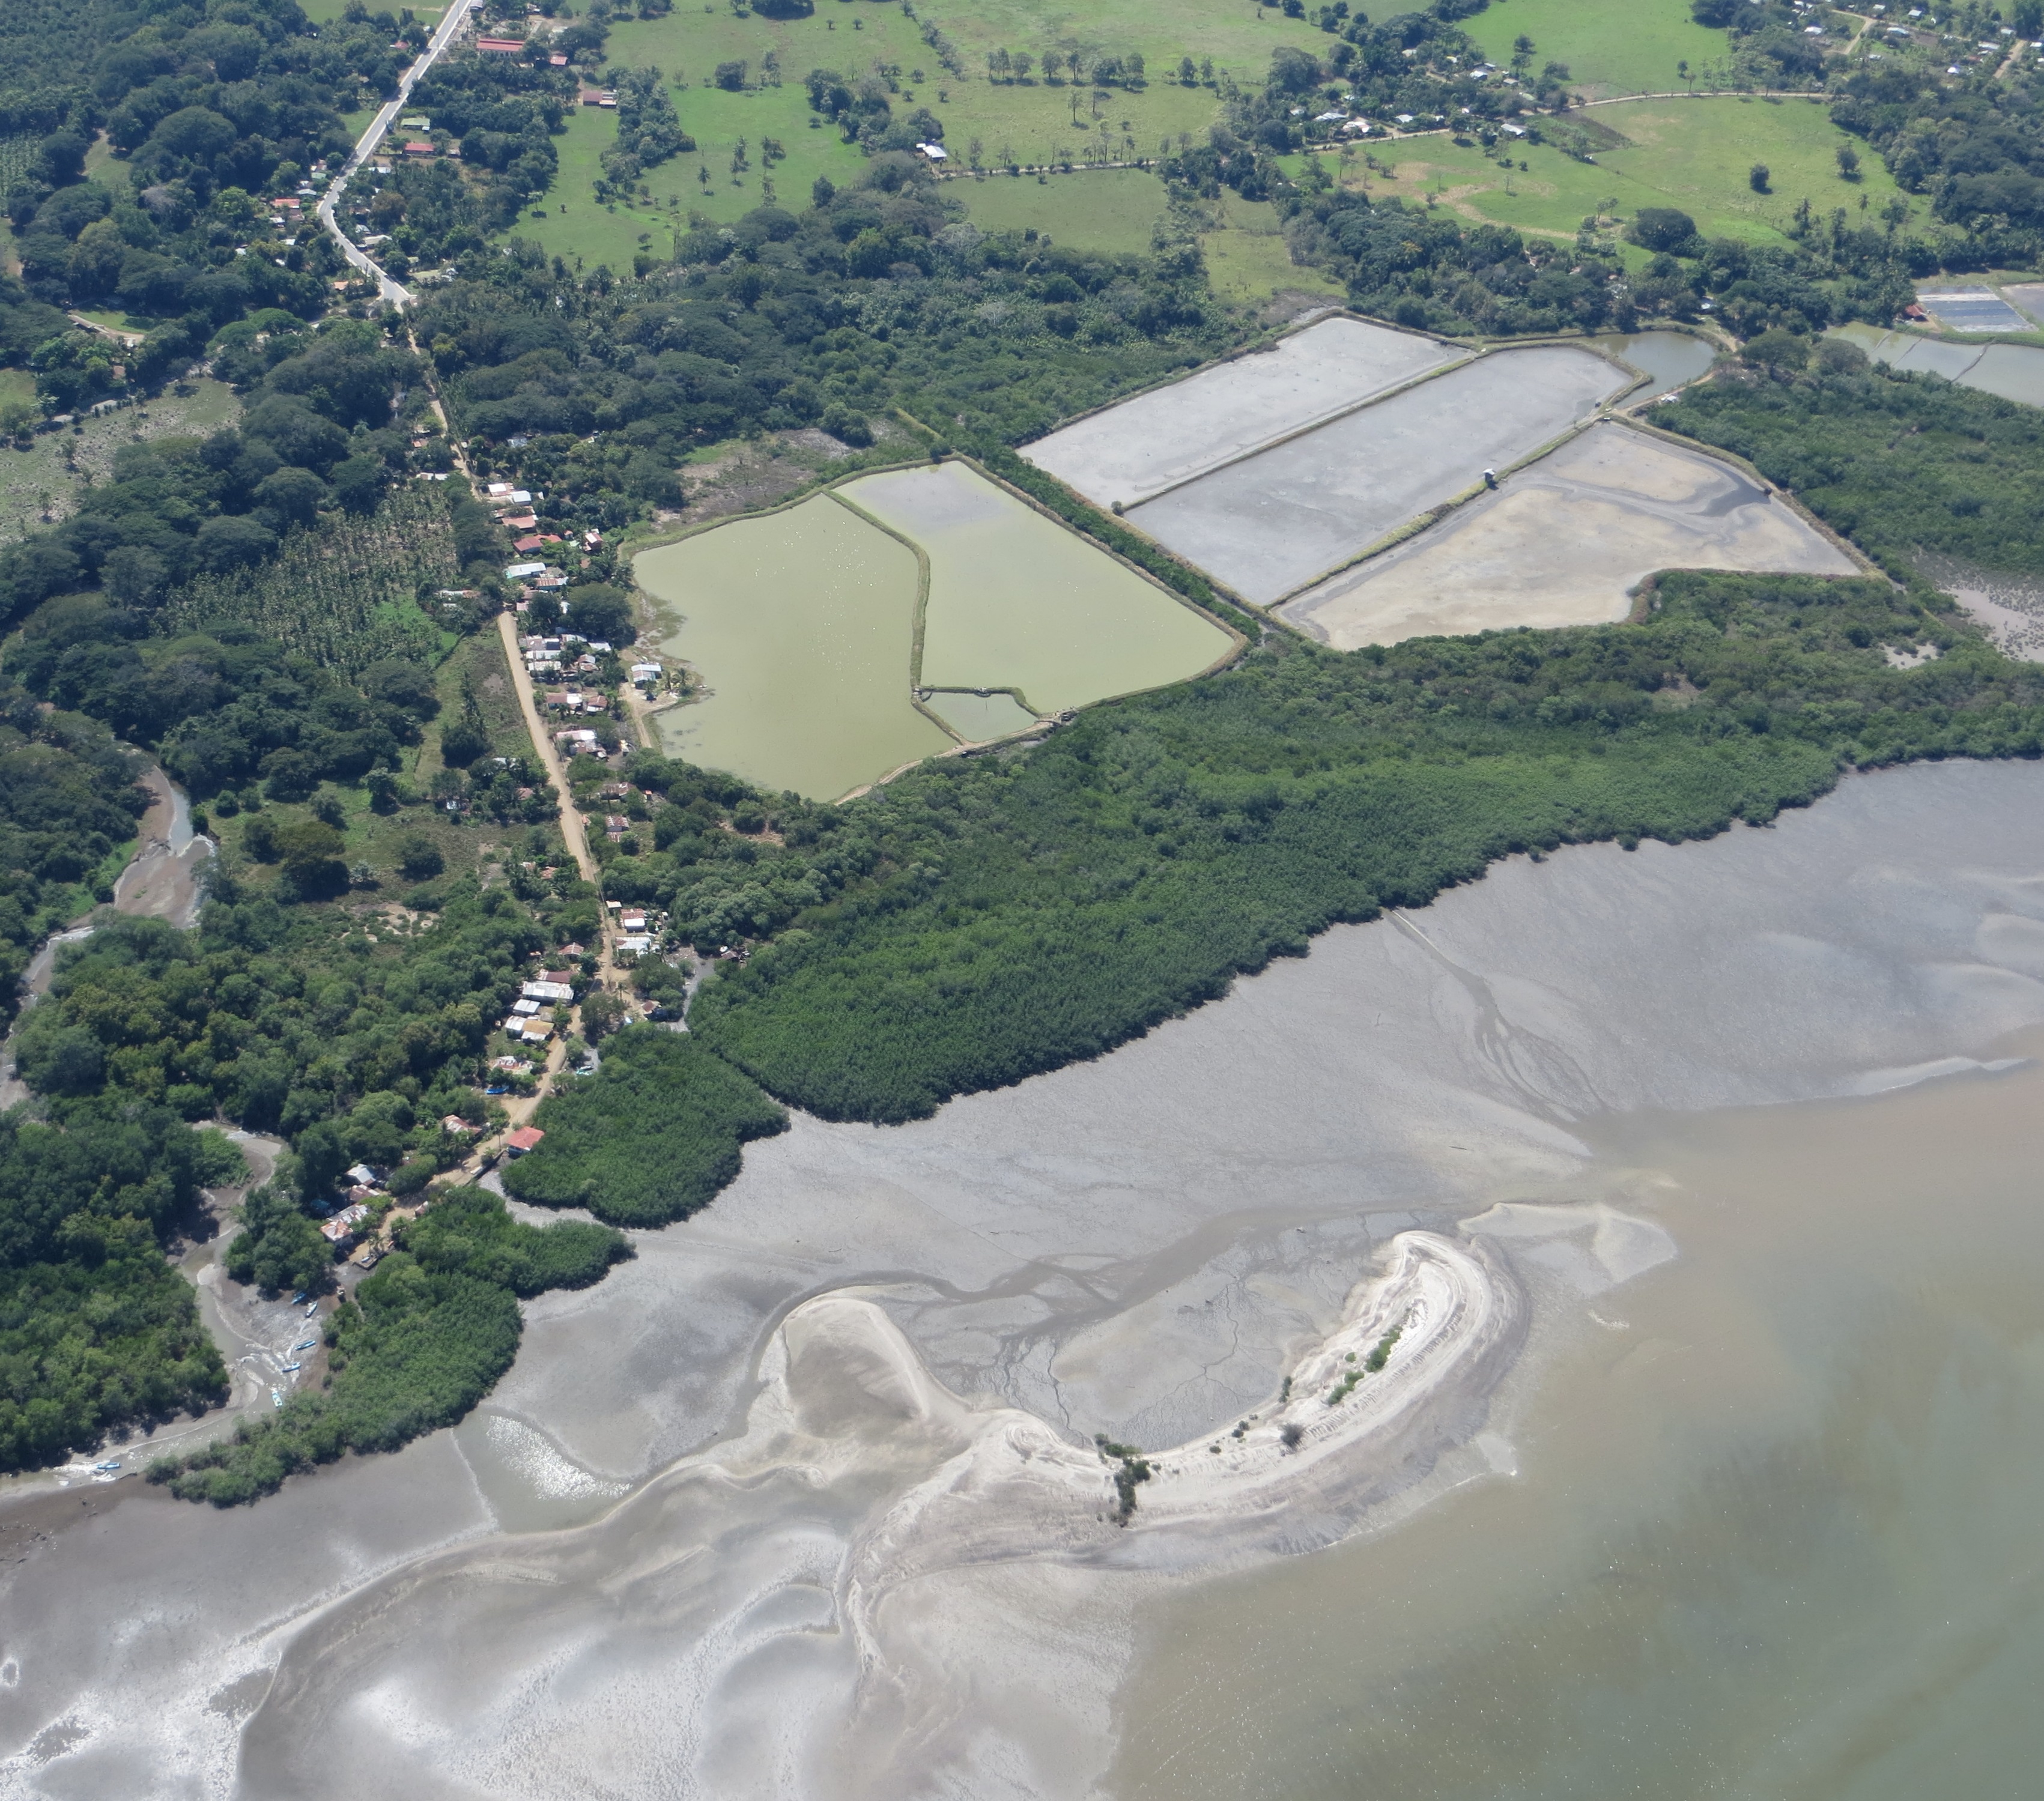
Aerial imagery helps identify areas suitable for restoration
The assessment of historical land use dynamics of coastal areas relies on geospatial analysis of a sequence of satellite images. It classifies land use categories and how their area changes over time. Using these dynamics, the quantification of carbon emissions associated with the conversion of mangrove forests to other land uses can be estimated through modeling. This provides both an assessment of carbon stocks lost as well as an identification of areas suitable for restoration. This can also be tied to estimates of natural capital lost over time.
The main requirement is the availability of a consistent series of satellite images that is free of cloud cover and offers enough spatial resolution to differentiate mangrove stands (and types), surrounding agriculture and other human uses of the landscape. Local or national capacities for remote sensing processing and advanced GIS analyses of coastal features is also important. Emissions modeling is a challenge, which needs to be resolved through enhanced capacities.
Although GIS facilities and trained personnel are readily available, capacities to properly classify different types of mangroves within a stand are still lacking in the GIS/remote sensing field, especially when higher resolution images are used. We have been exploring the application of innovative image processing and classification techniques with good results. However, the process cannot be fully automated and the analyses require time and expert judgement to complete.
Access to a consistently cloud-free series of images across different dates is a challenge. This is coupled with the malfunctioning of a well-known satellite, which further limits the availability of images suitable for analyses.
Scaling-up analyses from local to subnational to regional scales presents additional challenges of spatial resolution, data volume for analyses and time required.

