Spatial Intelligence for Wildfire Management

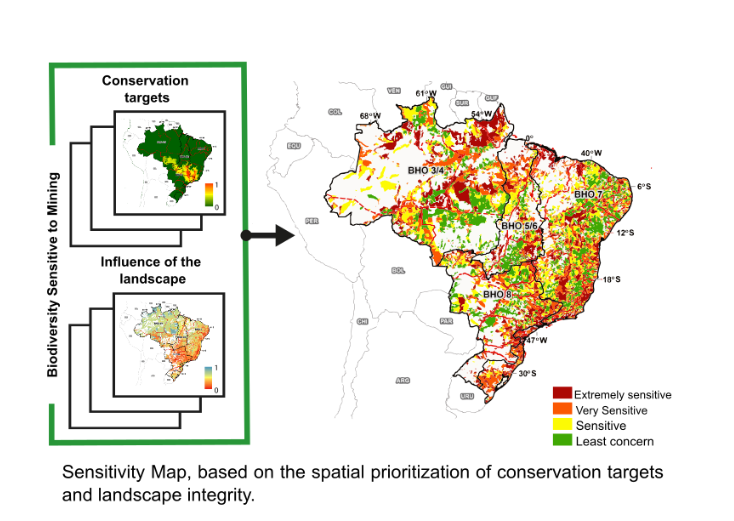
This building block provides the essential spatial intelligence for PyroSense, enabling a dynamic understanding of the geographical landscape. Its core purpose is to identify fire risk areas, pinpoint incident locations, and visualize resource deployment. This is crucial for strategic decision-making, allowing proactive resource allocation, and response planning. 

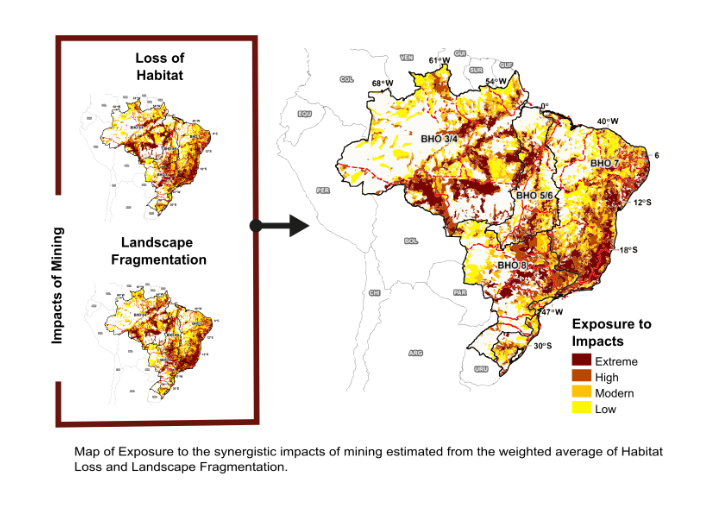
PyroSense utilizes a robust Geographic Information System (GIS) to power this function. The GIS integrates various spatial data layers, including topography, vegetation, infrastructure, etc. Initially, baseline risk maps are created by analyzing factors, guiding the placement of sensors and cameras.

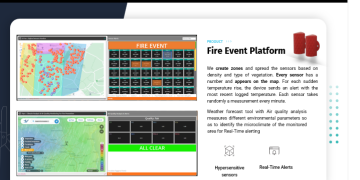
Upon detection of a potential fire by environmental sensors or AI, the system immediately feeds the precise coordinates into the GIS. This real-time location data, combined with meteorological data (local and satellite), enables dynamic risk assessments. The GIS also serves as a central operational dashboard, visualizing the real-time positions of all deployed assets, including drones and first responder teams. This facilitates optimal resource allocation and coordination. This critical information is then communicated via a web application to stakeholders, providing clear visual situational awareness and supporting informed decision-making. 

  • Accurate and Up-to-Date GIS Data: Access to current geospatial data on topography, vegetation,  historical fire activity is essential for reliable risk assessments.
  • A powerful GIS platform is necessary for integrating diverse data layers, performing complex analyses, and running real-time AI.
  • Expertise is needed to interpret GIS data, validate models, and use the platform for strategic planning and incident management.
  • Connectivity with environmental sensors, drone feeds, and meteorological data is crucial for dynamic risk mapping and accurate fire tracking.

The accuracy and utility of geospatial planning are directly proportional to the quality and timeliness of the underlying GIS data. Investing in high-resolution, frequently updated maps and environmental data is paramount. Furthermore, the ability to integrate real-time sensor and drone data into the GIS for dynamic risk assessment proved to be a game-changer, moving beyond static planning to predictive capabilities. 

Initial challenges included the significant effort required to collect and digitize comprehensive baseline GIS data for large, remote areas. Data standardization across different sources (e.g., various government agencies, local surveys) was also a hurdle. Additionally, ensuring the GIS platform could handle the computational load of real-time data fusion and complex fire spread simulations without latency issues was a technical challenge.

  • Before deployment, dedicate substantial resources to acquiring and standardizing all relevant geospatial data. 
  • Choose a GIS platform that can scale with increasing data volumes and computational demands.
  • Ensure that local teams are proficient in using the GIS platform  
Comprehensive Data Ingestion for Fire Detection

This is the comprehensive intake mechanism for all information vital to PyroSense's platform. Its purpose is to gather real-time data, from multiple origins, ensuring the system has the input needed for accurate analysis and effective decision-making. 

PyroSense integrates an agnostic and highly compatible array of data:

  1. Environmental IoT Sensors are strategically deployed, and continuously collect real-time CO2, temp. and humidity data. They are agnostic in type and protocol, compatible with MQTT, LoRa, Sigfox, and NBIoT, ensuring broad integration. For efficiency, they feature long-lasting batteries (up to 10 years), minimising maintenance.  

  2. Fixed cameras and drones capture high-resolution images and live video. Integrated Vision AI processes this visual data in real-time to detect anomalies like smoke or fire. 

  3. PyroSense gathers data from local weather stations and satellites. Combining granular local data with broad satellite coverage provides a comprehensive understanding of current weather.

  4. GIS provides foundational spatial information, including maps of terrain, vegetation,  infrastructure, etc. 

  5. Firemen Wearables monitor real-time biometrics. AI enhances data for risk pattern recognition, of fatigue or heat stress. Real-time alerts are sent to nearby teams or control centers, enabling proactive intervention.

  • Reliable Sensor Deployment: Sensors should be strategically placed, well-installed, ensuring continuous data collection and security.
  • Data Stream Integration: Integrating data from various sensors, cameras, drones, and meteorological sources is crucial for situational awareness.
  • Data Quality and Calibration: Ensure all data sources are calibrated and high quality to avoid false alarms.  
  • Secure Data Transmission: A strong communication is vital for secure, low-latency data transfer from remote locations.

The diversity and agnosticism of data sources are critical for comprehensive and resilient fire detection. Relying on a single type of sensor or communication protocol creates vulnerabilities. The ability to integrate data from various IoT sensors, visual feeds (cameras, drones), meteorological data, and even human biometrics provides a robust, multi-layered detection system that significantly reduces false positives and increases detection accuracy.

  • The platform must be software and hardware agnostic.
  • Cybersecurity and intercommunication are crucial.

A significant challenge was ensuring seamless interoperability between different sensor types and communication protocols (e.g., MQTT, LoRa, Sigfox, NBIoT) from various manufacturers. As well as, maintaining connectivity in remote, terrains for all sensor types was also an ongoing effort, despite long battery life.

  • Design your system to be compatible with multiple IoT communication protocols from the outset. 
  • Develop algorithms for data validation and fusion to cross-reference information from disparate sources.
  • Consider hybrid communication solutions (e.g., satellite for remote areas)
Sensors and Weather Data
West and South Europe
Panagiotis
Apostolopoulos
Comprehensive Data Ingestion for Fire Detection
Spatial Intelligence for Wildfire Management
Stakeholder Communication & Wildfire Awareness
Core Technologies & Supporting Infrastructure
Protecting Ecosystems Through Fire Prevention Technology
Vulnerability Map biodiversity and speleological heritage to the potential impacts of mining dam ruptures.

It is the analysis that produces a map with the gradient of vulnerability to the potential impacts of mining tailings dam collapses for environmental risk management. It is the product of cross-referencing information on the impact of potential environmental degradation resulting from the collapse of mining dams and the sensitivity of biodiversity.

  • Sharing of geospatial information with regulatory agencies in the mineral sector;
  • Access to specialist knowledge through collaboration with the National Centers for Research and Conservation of Fauna (ICMBio) and Flora (CNC-Flora/JBR) to identify conservation targets

The effort was necessary to meet a demand for information on environmental vulnerability perceived by the Institute itself in light of the catastrophic events that have occurred in Brazil in recent years with the collapse of mining dams.

Hierarchical Grouping Map of Conservation Targets for Strategic Environmental Compensation

Process that defines the most suitable areas for offsetting environmental impacts based on analyses of the similarity of the composition of biodiversity and geodiversity sensitive to mining. This map assumes that the best place to invest efforts to offset the impacts of a mining activity will be those that share the largest number of conservation targets affected by the project. To this end, a spatially explicit hierarchical cluster analysis was performed, which indicates a gradient of similarity between impacted and protected areas, grouped into groups and clusters for offsetting.

  • Access to specialist knowledge through collaboration with the National Centers for Research and Conservation of Fauna (ICMBio) and Flora (CNC-Flora/JBR) to identify conservation targets.
  • Knowledge accumulated in the management of federal conservation units, especially in the application of environmental compensation resources.
  • Brazilian legal framework that provides for the allocation of financial resources from projects that promote significant environmental impacts, such as mining, to strengthen the system of conservation units for environmental compensation purposes (Law No. 9,985, of July 18, 2000, which institutes the National System of Nature Conservation Units).

The analyses showed potential for refining the criteria currently established by Brazilian legislation for compensating environmental impacts

Assessing the Compatibility of Mining with Biodiversity and Speleological Heritage Conservation

The Compatibility Map between Biodiversity and Speleological Heritage Conservation and Mining Activities is represented as a bivariate map, resulting from the spatial overlay of two key components: the Biodiversity Sensitivity Map and the Mining Impact Exposure Map. This integrated approach allows for the identification of areas where conservation priorities and mining pressures intersect, providing a spatial framework to support more informed land-use planning.

In this context, the higher the compatibility of a given area, the lower the associated environmental cost. Such areas are likely to involve less complex environmental licensing processes and require fewer efforts to mitigate biodiversity loss. Conversely, areas of low compatibility indicate a greater potential for conflict between conservation and mining activities.

Impact reduction is primarily achieved by prioritizing the avoidance of low-compatibility zones. Where avoidance is not feasible, specific mitigation and/or compensation measures—tailored to the conservation targets present—must be adopted to ensure the persistence of biodiversity within impacted areas.

This approach demonstrates that it is possible to reconcile biodiversity and geodiversity conservation with mineral extraction through science-based, spatially explicit planning tools that support sustainable development.

  • Well-established theoretical and methodological bases that technically support the tool.
  • Spatial information generated that can be explored by different GIS tools and inserted into Web Map Service (WMS) environments, which facilitate application by the user.

Identification of how the environmental layer has been weakly included in the planning of economic activities and mainly that there is a demand for more precise information on environmental costs in activity planning.

Spatial Sensitivity Assessment of Biodiversity and Speleological Heritage to Mining

The Biodiversity Sensitivity Map provides a spatial representation of the varying degrees of vulnerability of conservation targets to mining-related impacts. It integrates biological and ecological characteristics of species and ecosystems, along with the influence of anthropogenic pressures, to create a comprehensive sensitivity gradient—referred to as the Biodiversity Sensitivity Index.

This index ranks the entire study area into four sensitivity classes, ranging from “Extremely Sensitive Areas” to “Less Concerning Areas”, with each category representing approximately 25% of the total area. The classification follows principles of systematic conservation planning, incorporating spatial representations of both the distribution and sensitivity of each conservation target.

Certain species, habitats, or ecosystem services are more vulnerable due to intrinsic biological or ecological traits, or due to their geographic location. Moreover, the model considers landscape-level attributes—such as environmental conditions that either support or hinder biodiversity persistence—that are not directly tied to the mining threat but are critical for understanding overall ecological resilience.

Importantly, only targets that are likely to become even more vulnerable in the absence of preventive or mitigation measures were included in the mapping, ensuring that the tool supports strategic planning and prioritization for conservation in the context of mineral exploration.

Key enabling factors for the development of the biodiversity sensitivity map included access to specialized knowledge through collaboration with the National Centers for Research and Conservation of Fauna (ICMBio), and utilization of the Biodiversity Extinction Risk Assessment System (SALVE) (https://salve.icmbio.gov.br), which contains occurrence records validated by taxonomic experts. Additionally, coordination with the National Center for Flora Conservation (CNCFlora) (http://cncflora.jbrj.gov.br/portal) was essential for the identification of priority conservation targets for flora.

The construction of the tool contributed to the improvement of participatory methods, considering that the involvement of different actors in the discussion and elaboration of PRIM Mining is crucial to guarantee transparency in the processes of defining targets and analysis parameters, increasing the reliability, robustness and scope of the results.

Identifying areas most impacted by mining activities - Impact Exposure Map

A process designed to estimate the chronic impacts of mining activities on the landscape—such as habitat loss, fragmentation, and degradation. This analysis generates a gradient of exposure for biodiversity and speleological heritage, indicating varying levels of environmental damage severity. The mining impact exposure map provides a spatial representation of the risks to which conservation targets are subjected, allowing for a detailed assessment of biodiversity vulnerability. Identifying the areas most intensely affected by mining enables more strategic and informed planning efforts to minimize biodiversity loss.

The process involves coordination with sectoral bodies, the systematization of environmental data, and the validation of results through expert consultation. The methodologies employed are scientifically validated, widely accepted by the academic community, and designed to be replicable across different regions and landscape scales.


The construction of this layer was made possible by the increasing efforts of MapBiomas to map all remaining forest cover at the national scale in Brazil, as well as the National Mining Agency (Agência Nacional de Mineração - ANM) for providing the polygons of authorized mining processes across the country.

Access to accurate spatial data for calculating landscape metrics, combined with a network of collaborating experts in the field, enabled a participatory and transparent development of the results.

We gained valuable insights throughout the development of this layer and significantly evolved our approach by actively sharing information with the mineral sector and research institutions.

During the construction of a synergistic impact layer for mining activities, we identified a significant gap in available data, quantitative metrics, and modeling frameworks necessary to incorporate well-documented impacts—such as noise generation, vibration, air pollution, and soil and water contamination—at this spatial scale. This process highlighted the critical need to enhance impact assessments by accounting for the synergistic and cumulative effects of mining activities.


Data and knowledge sharing

This component fosters collaboration, transparency, and co-learning among conservation stakeholders by facilitating the open and inclusive exchange of data and insights. By ensuring that conservation strategies are informed by the latest findings, and that communities and researchers work toward shared goals, the platform strengthens collective action for lemur protection. Through targeted communication, training workshops, and education campaigns, it empowers local communities, supports academic engagement, and raises public awareness around biodiversity conservation.

This component directly supports GBF Target 21 (enhancing knowledge sharing and access to data) and Target 22 (inclusive and equitable participation in biodiversity actions), by ensuring that knowledge is not only available, but also usable and co-developed by those closest to the ecosystems in question.

  • Open-access policies that allow broad usage of data while respecting ethical boundaries.
  • Regular updates and communication between conservation organizations to align efforts.
  • Training workshops and educational sessions-especially on the use of technology-for local communities, conservation teams, and students, enabling them to contribute to and benefit from the portal.
  • Integration of feedback from stakeholders to refine and improve tools and processes.
  • Educational outreach to promote conservation literacy and foster shared responsibility for the environment.

While data openness is important, some sensitive information such as the exact location of endangered species must remain restricted to protect biodiversity. Additionally, training and outreach efforts must account for technological and language barriers to ensure equitable participation. For example, local dialects and offline alternatives may be needed to reach more remote or marginalized groups. Sustained funding is also essential to maintain these educational and communication activities over time, ensuring they evolve with user needs and remain impactful in the long term.