Spatial and Temporal Characteristics Analysis of Wetland Vegetation

Spatiotemporal analysis was conducted to reveal long-term distribution patterns of wetland vegetation within the protected area from 1990 to 2022.

  • Figure 1A illustrates changes in vegetation spatial patterns over time.
  • Figure 1B presents percentage vegetation cover along the sea–land gradient.

Analytical tools such as landscape pattern indices, migration models, and expansion–contraction dynamics were used to quantify ecological changes.

Key Findings

  • Spartina alterniflora exhibited high spatial aggregation but showed a declining trend over time.
  • Phragmites australis and Suaeda salsa displayed greater fragmentation and increasing spatial coverage.
  • Vegetation migration exhibited significant heterogeneity and a clear banded distribution along the land–sea gradient.

GBF Alignment: Aligns with GBF Target 2.
Contribution: Measurable outcomes enhance restoration planning, filling gaps in uniform management approaches.

  • Temporal and spatial heterogeneity necessitate multifaceted analysis methods.
  • Spatial analyses provide crucial ecological insights that inform targeted conservation and management strategies.
  • Temporal and spatial heterogeneity of vegetation dynamics require multi-faceted analytical approaches.
  • Spatial analyses revealed critical ecological patterns, aiding targeted management strategies.
Data Quantification and Database Establishment

A comprehensive geospatial database was developed, integrating vegetation cover data derived from remote sensing with key environmental, climatic, and anthropogenic variables. Included metrics encompassed soil salinity, sea surface temperature, seawater salinity, and locations of aquaculture ponds, providing a robust analytical foundation.

GBF Alignment: Supports GBF Target 21.
Contribution: Integrates diverse data layers for holistic analysis, adding value to fragmented conservation datasets.

  • Field validation confirmed the accuracy of remote sensing interpretations (see Figures 1 and 2).
  • The database facilitated the integration of spatial and environmental data, supporting multi-variable analyses and ecological modeling.
  • Accurate ground-truth data are vital for validating remote sensing outputs and ensuring database reliability.
  • A well-structured, multi-source database improves analysis efficiency and enables more sophisticated correlation and causality studies.
Wetland Vegetation Type Identification

Vegetation index time series were smoothed using Gaussian fitting to reduce noise and extract key phenological features. A random forest deep learning algorithm was applied to classify wetland vegetation into three dominant types: Spartina alterniflora, Phragmites australis, and Suaeda salsa. Classification accuracy from 1990 to 2022 was validated through field surveys.

GBF Alignment: Contributes to GBF Target 6.
Contribution: Reduces invasive species impact by accurately identifying Spartina alterniflora for targeted control, addressing a key biodiversity threat.

  • Gaussian curve fitting effectively minimized noise in raw vegetation index curves, enhancing classification accuracy.
  • The random forest algorithm leveraged spectral differences between species, enabling robust feature extraction and reliable identification.
  • Spectral features related to vegetation moisture and structural attributes significantly improved interspecies separability.
  • Preprocessing steps such as curve fitting and denoising were essential for improving the reliability of long-term classification.
Data collection

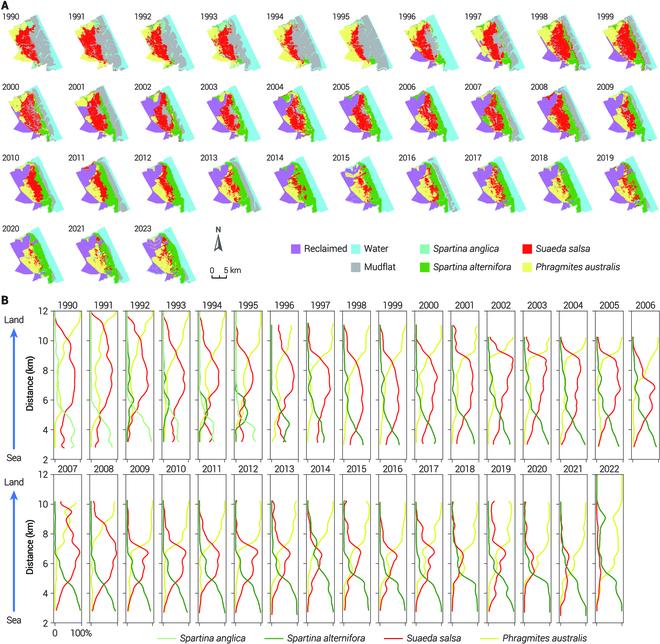
Using the Google Earth Engine (GEE) platform, Landsat series remote sensing data from 1990 to 2022 were systematically acquired, encompassing TM5, ETM+ (Landsat 7), OLI (Landsat 8), and OLI (Landsat 9) sensors. To ensure data quality for subsequent analyses, key spectral bands—near-infrared (NIR), red, and green—were selected and fused.

GBF Alignment: Supports GBF Target 21.
Contribution: Enhances decision-making with real-time, validated datasets, adding value to existing conservation efforts through technological innovation.

  • Only remote sensing images with cloud cover ≤10% were selected, followed by radiometric and atmospheric correction via batch processing.
  • Vegetation-specific information was extracted using optimized band combinations, particularly leveraging the high reflectance of vegetation in the NIR range.
  • Limitations in spatial, temporal, and spectral resolutions introduced potential uncertainties, highlighting the importance of robust radiometric and geometric correction methods.
  • Data fusion across different Landsat sensors was essential for achieving consistent long-term time series, though it required substantial additional processing to harmonize spatial and temporal resolutions.
Academic Communication

Results were disseminated via an academic paper in Ocean-Land-Atmosphere Research (a Science Partten Journal) and shared in AAASScience WeChat Public (Official Media of American Association for the Advancement of Science in China). The findings were also included as a case study in the Yangtze River Delta Pilot Site and included in the support of major research projects on oceanography by the National Natural Science Foundation (NSFC).

By systematically integrating remote sensing data, deep learning, and ecological analysis, the project has significantly advanced wetland conservation methodologies, offering scalable solutions for biodiversity preservation,  biological invasion control,  and ecosystem management globally.

Key Drivers of Vegetation Evolution

Exploring and analysing the key drivers of vegetation spatial and temporal distribution is of practical significance for monitoring the expansion of coastal wetland vegetation, species diversity conservation and sustainable management of coastal wetlands.

  • Spartina alterniflora was influenced by marine factors (e.g., salinity and wave height).
  • Phragmites australis and Suaeda salsa were driven by rainfall, anthropogenic activities, and interspecific competition.

Understanding these factors supports better management of invasive species and promotes biodiversity conservation.

Spatial and Temporal Characteristics Analysis of Wetland Vegetation

Using spatial-temporal data, the long-term distribution characteristics of wetland vegetation were analyzed. Tools such as the landscape pattern index, migration modeling, and expansion/decline dynamics identified distinct trends:

  • Spartina alterniflora patches showed high aggregation and a decreasing trend.
  • Phragmites australis and Suaeda salsa patches displayed lower aggregation, higher fragmentation, and increasing trends.
  • Vegetation migration patterns revealed significant spatial and temporal heterogeneity, with vegetation distributed in bands along the terrestrial gradient.
Data Quantification and Database Establishment

A comprehensive database was created, integrating remote sensing-derived vegetation cover with key environmental, climate, and human activity data. This includes metrics such as soil salinity, sea surface temperature, seawater salinity, and aquaculture pond locations, forming a robust foundation for further analyses.

Wetland Vegetation Type Identification

A Gaussian function was applied to vegetation index time series to extract candidate features, while a deep learning algorithm identified three major vegetation types (Spartina alterniflora, Phragmites australis, and Suaeda salsa). Field validation confirmed the model's accuracy, enabling precise vegetation classification from 1990 to 2022.

Data collection

Using the Google Earth Engine (GEE) platform, Landsat TM/OLI series remote sensing data from 1990 to 2022 were collected, covering TM5, ETM+7, OLI8, and OLI9. Key spectral bands (near-infrared, red, and green light) were fused to ensure high-quality data for subsequent analysis.