At the stakeholder consultation workshop, three urban EbA measures were identified and selected to pilot in Dong Hoi city, including:
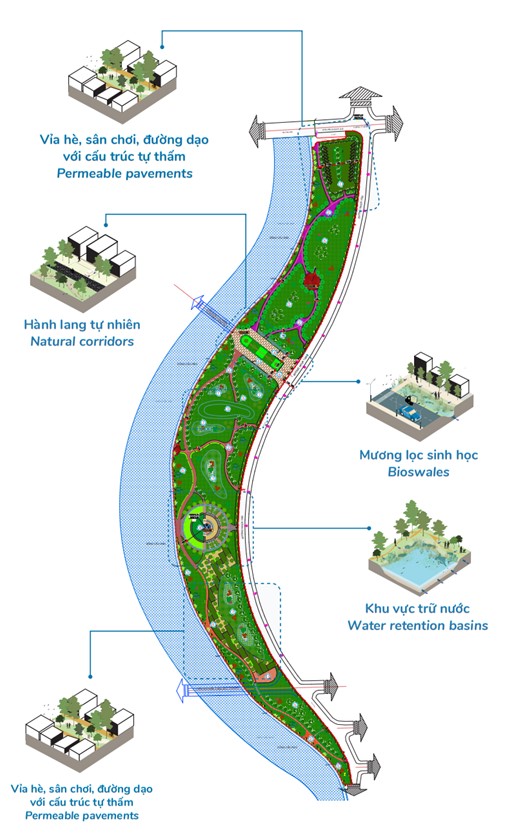
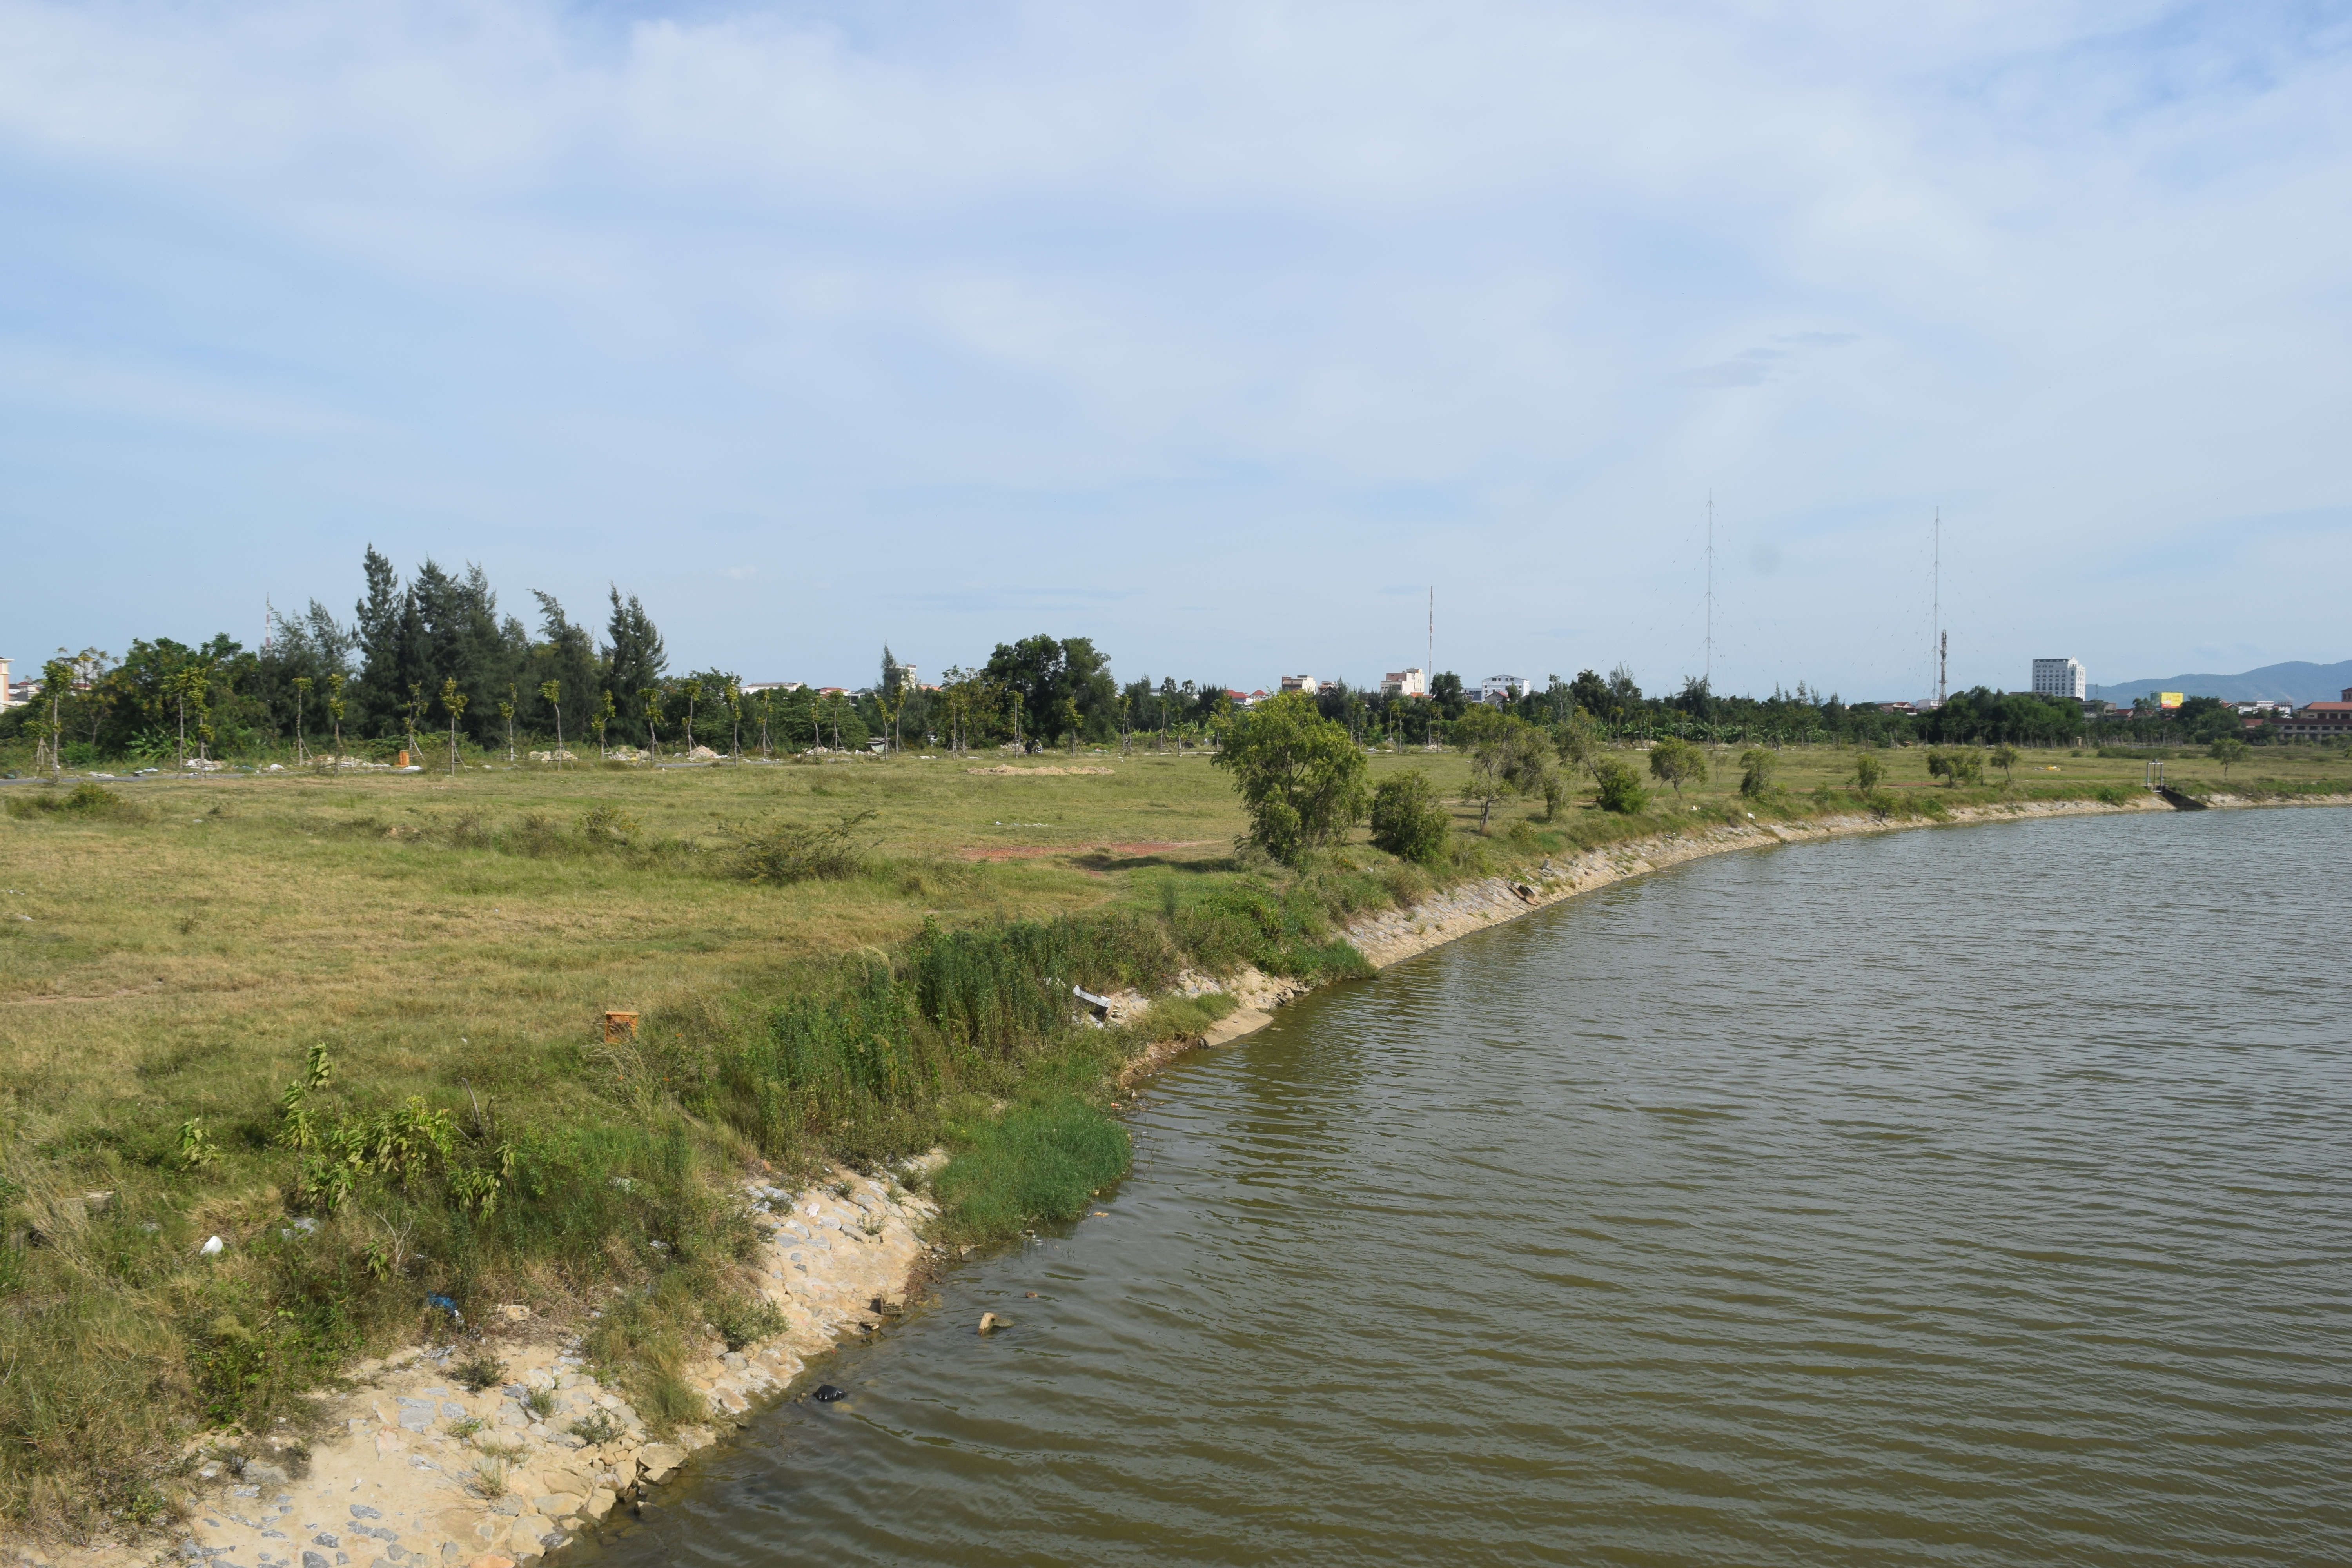
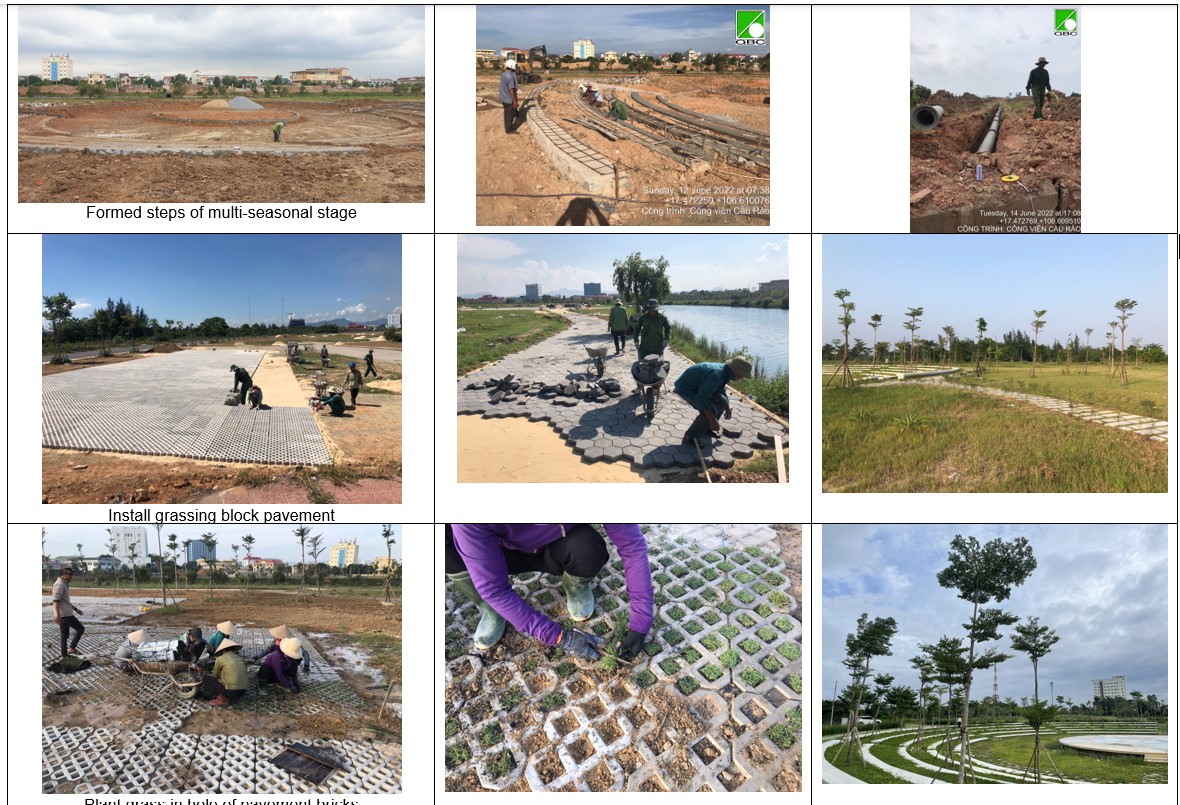
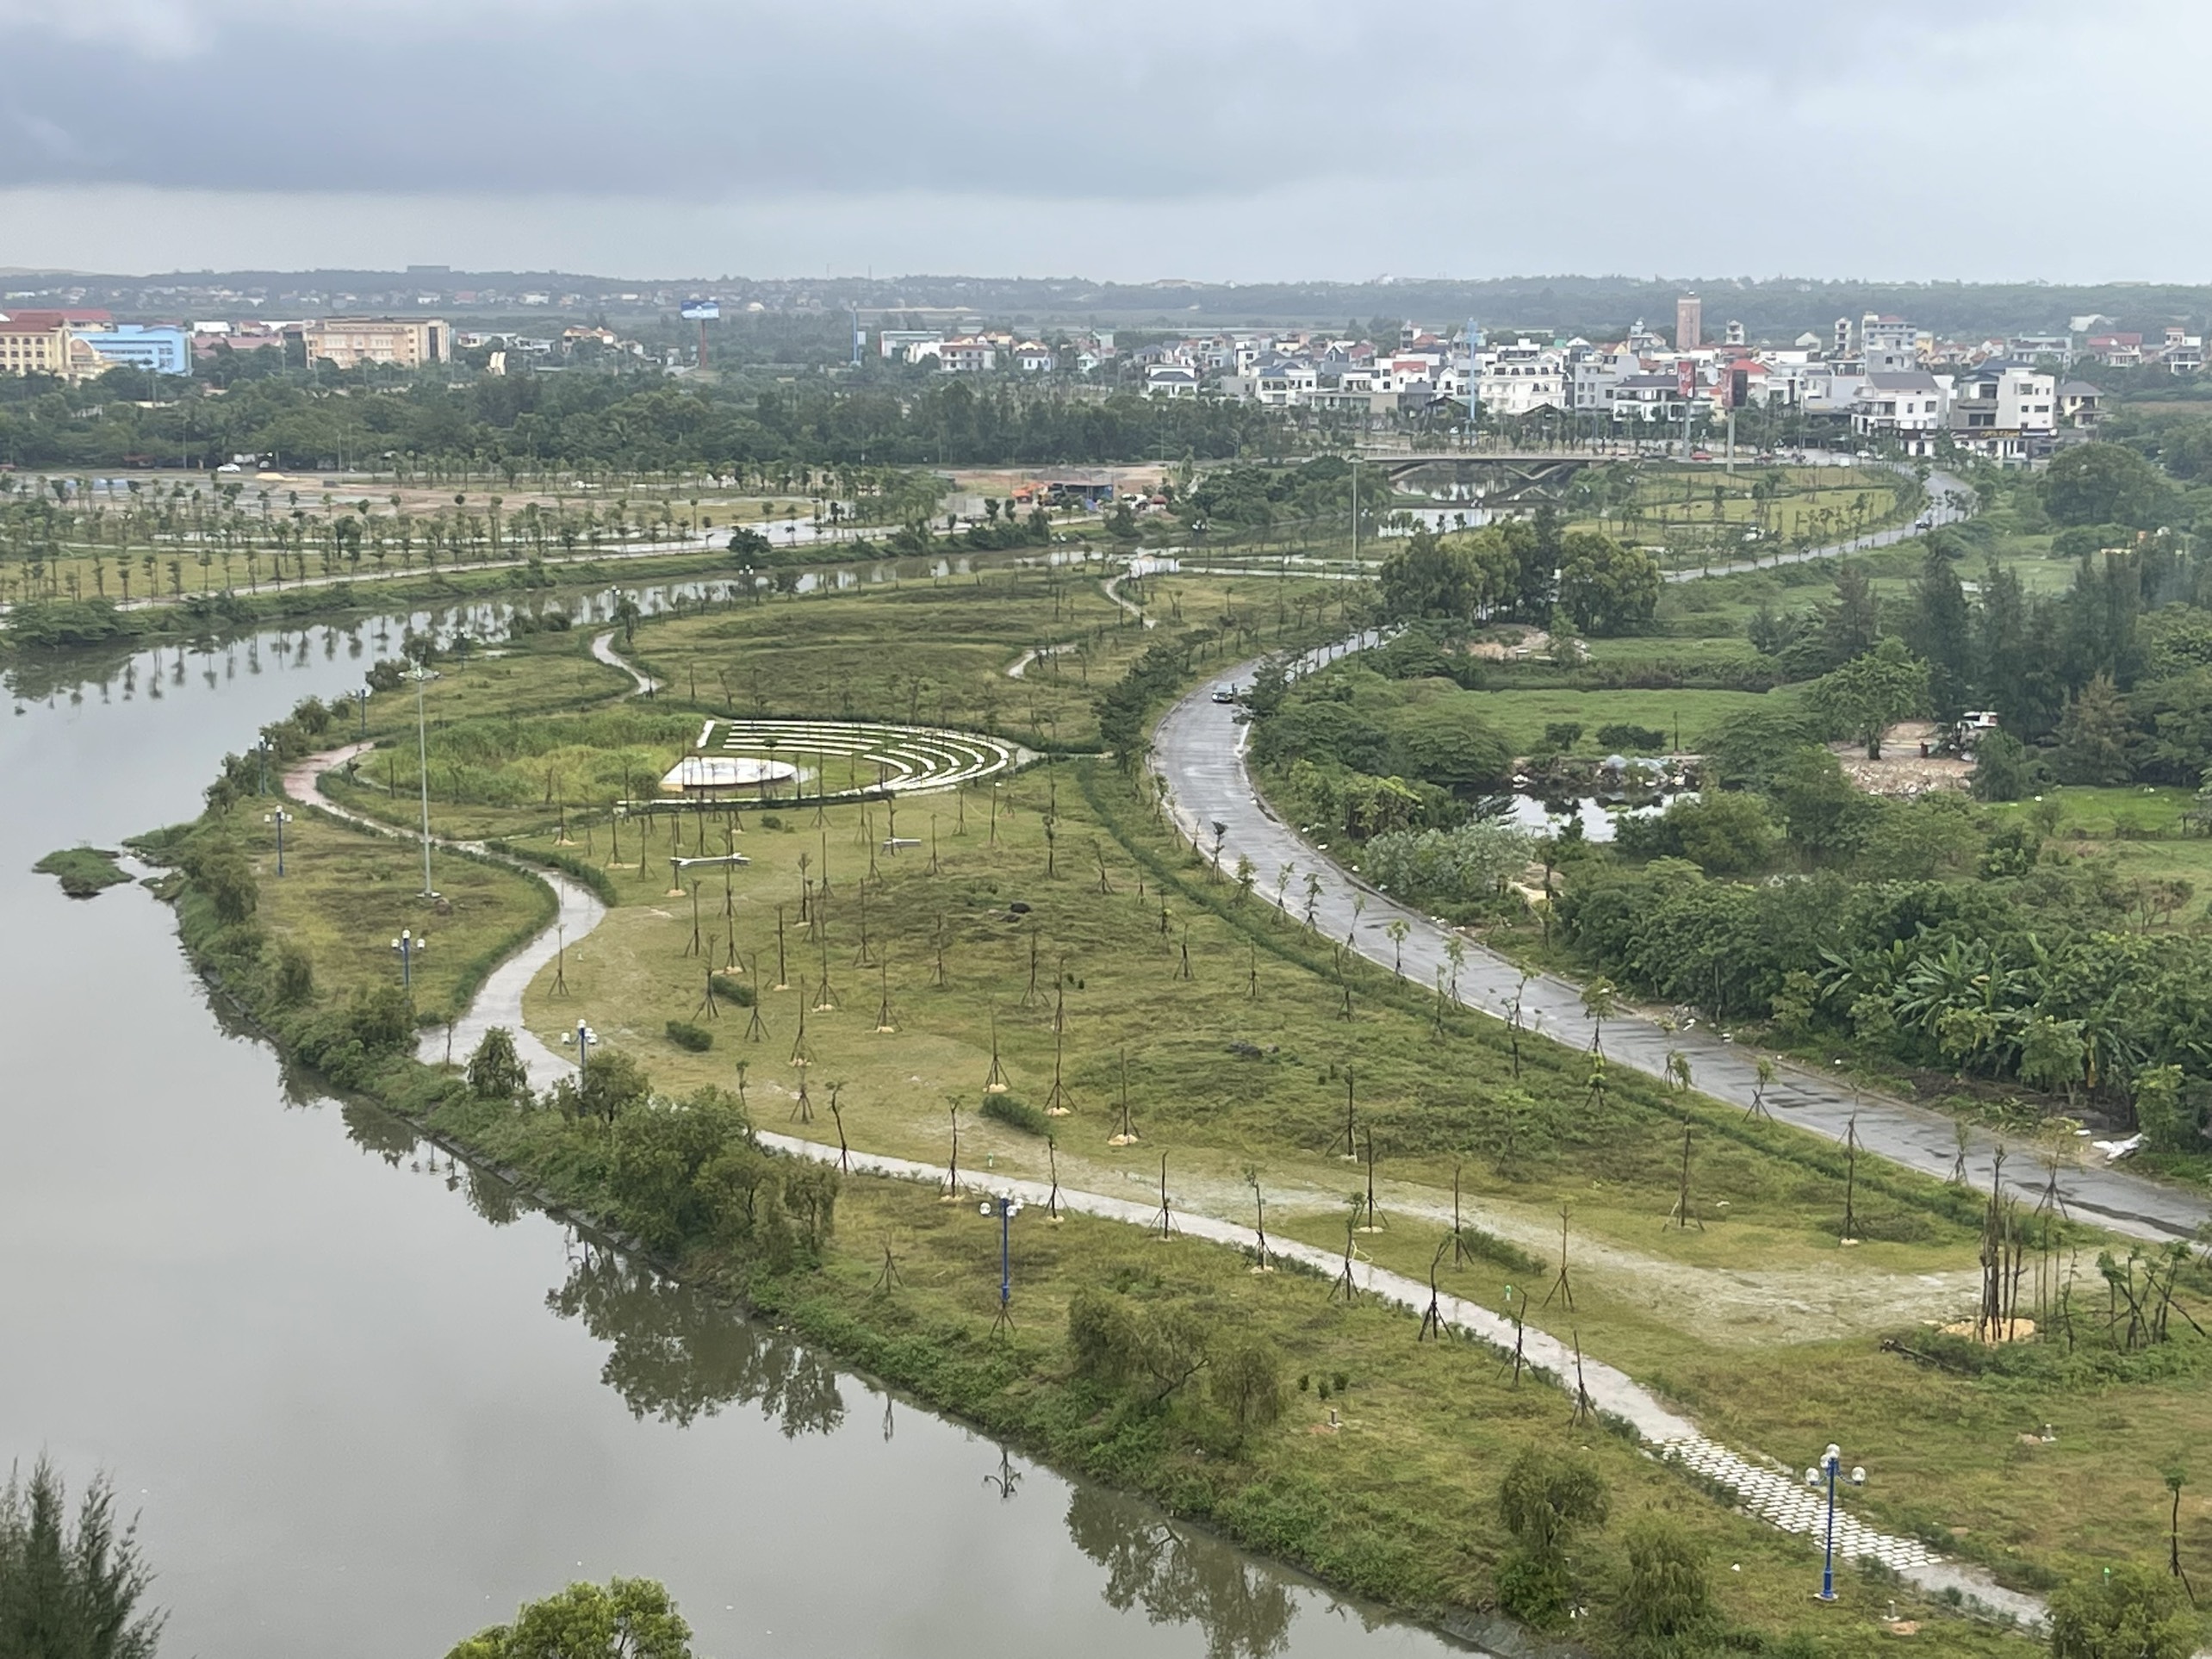
1) The water retention measure aims to address flood risk through water retention and delayed runoff during flooding, and heat stress reduction in the core urban zone of Dong Hoi City. It integrates urban flood risk management, relieves pressure on Cau Rao River as the main floodway protecting the city, improves existing ecosystem health, and increases blue-green space for the city. The measure is designed with multiple urban EbA components, including (1) a water retention area for flood reduction, (2) permeable surfaces (e.g. using native species of grass, vegetation and pavement) for storing water runoff, (3) swales along the existing road to reduce runoff and infiltration of pollutants, (4) additional trees to provide shading and regulate microclimate, (5) a protected area for habitat and to enable scientific investigation.
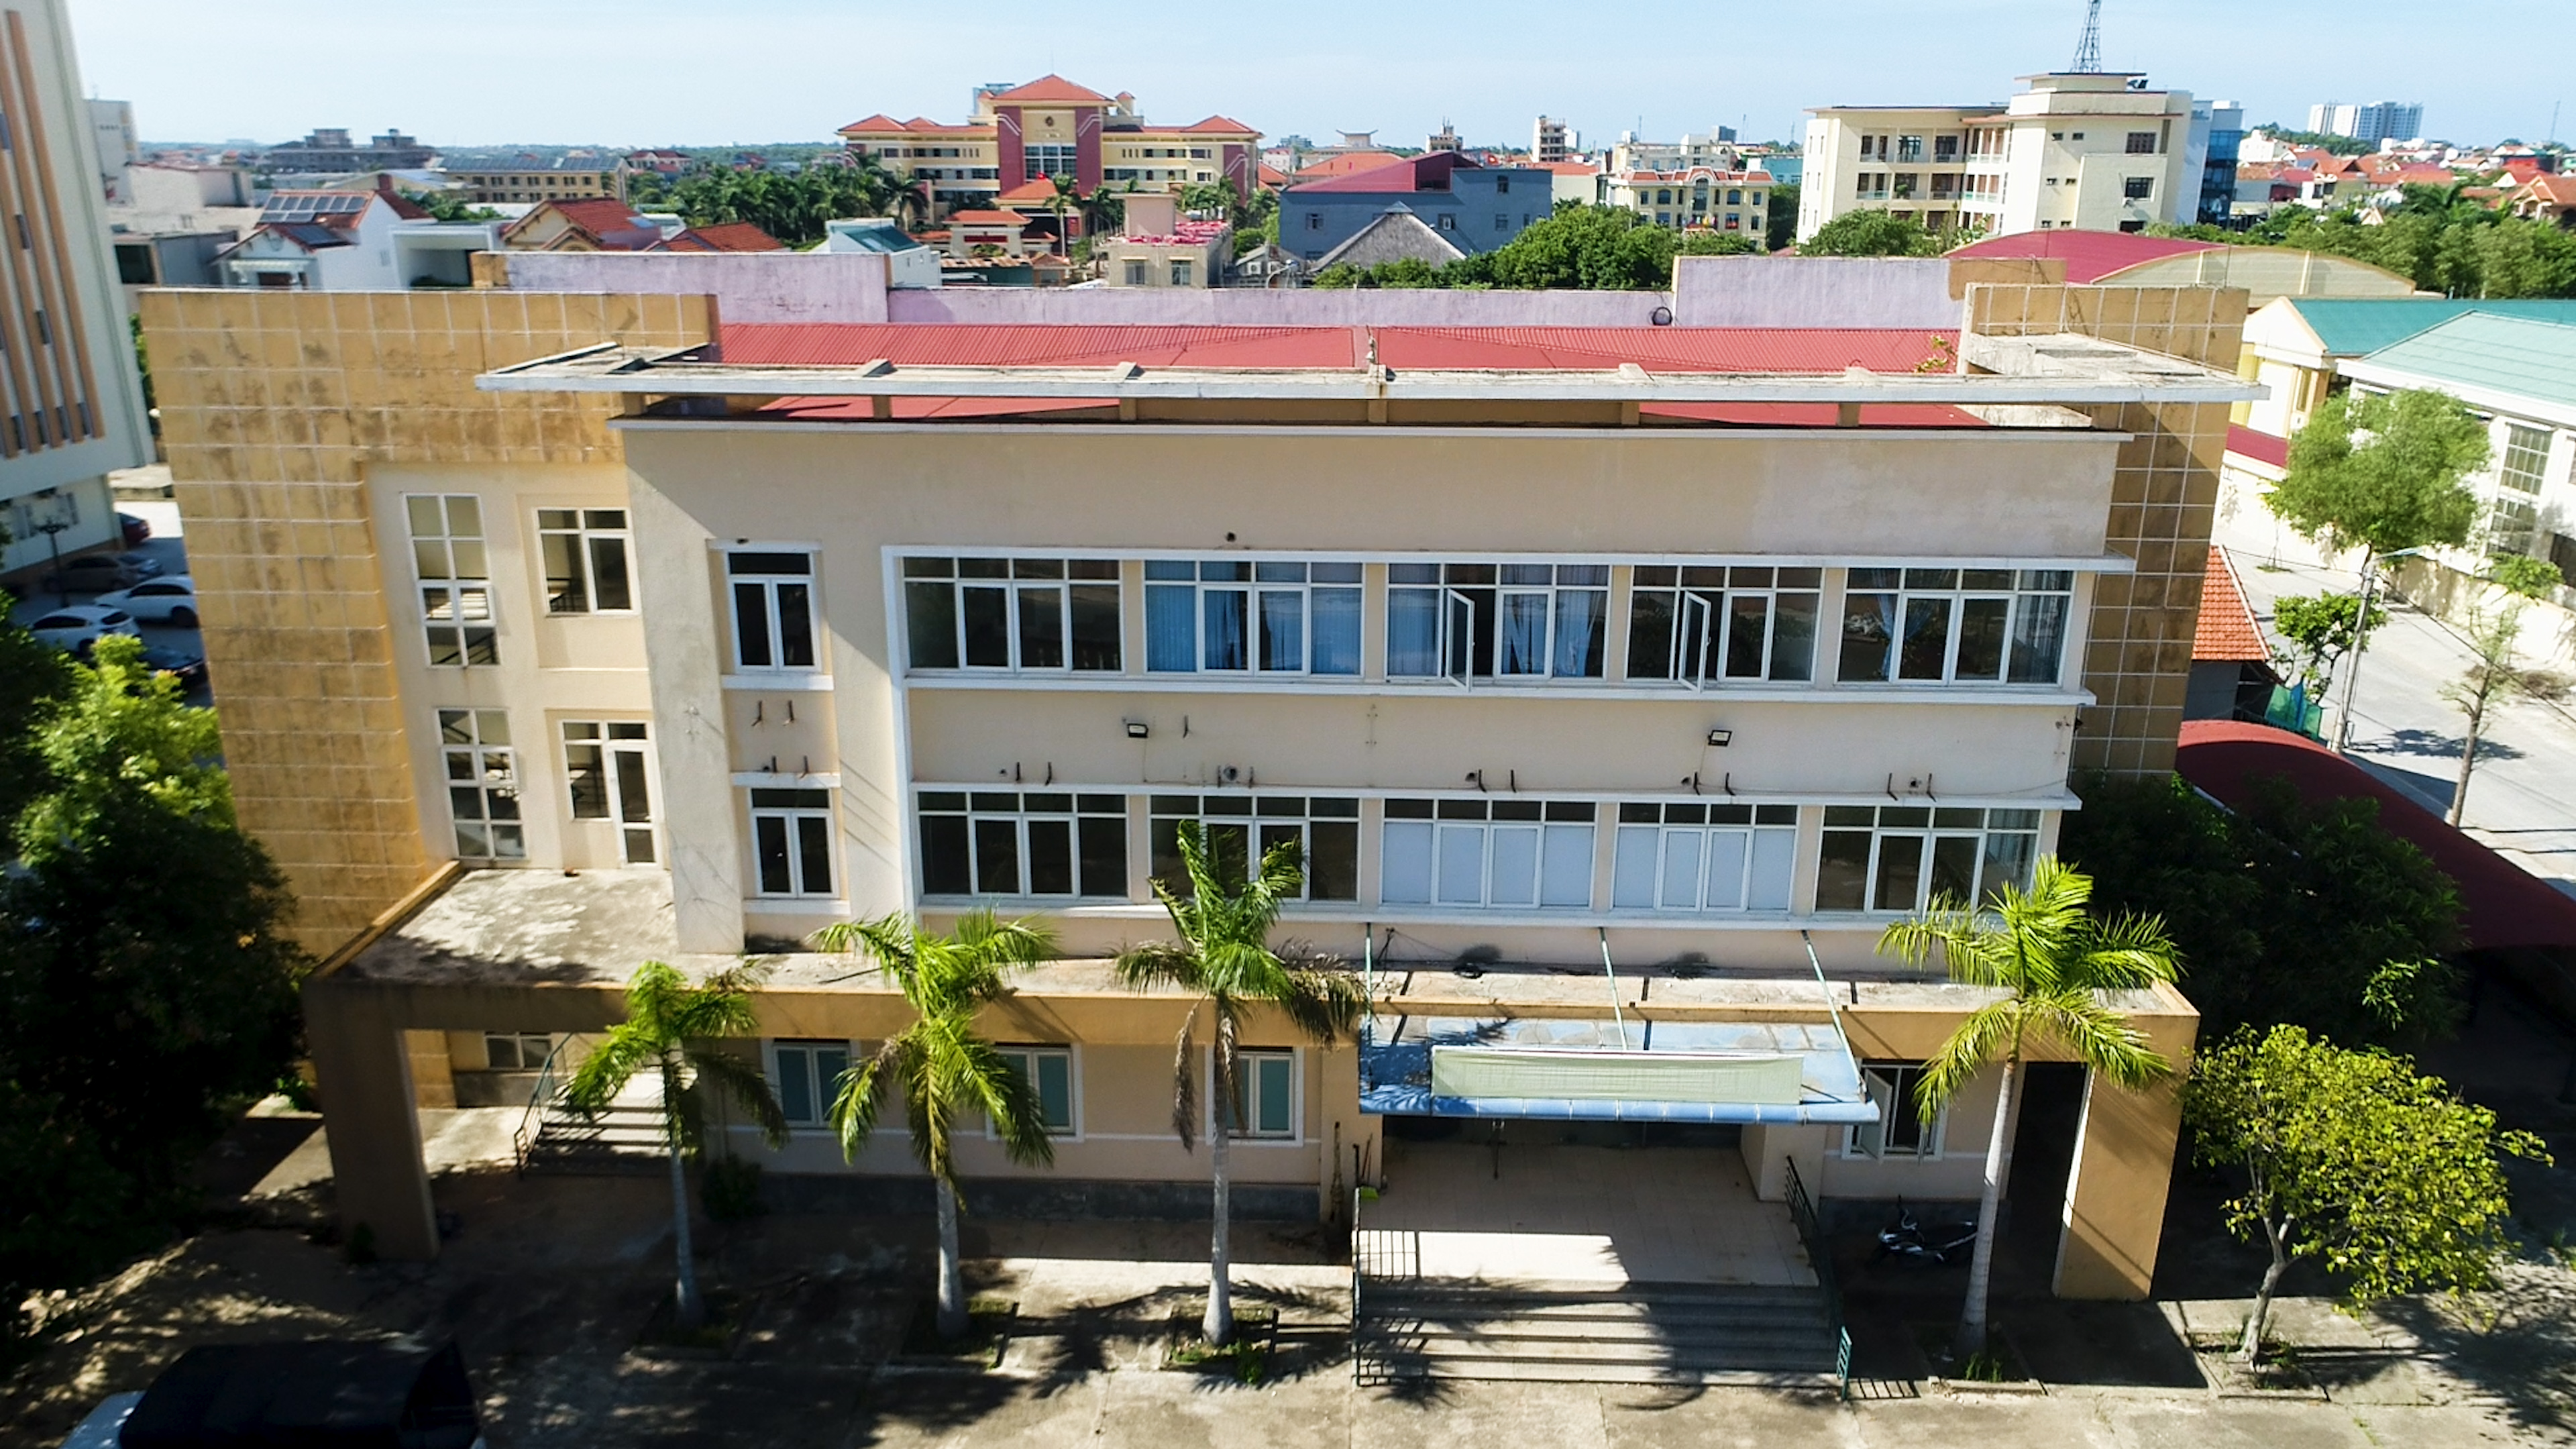
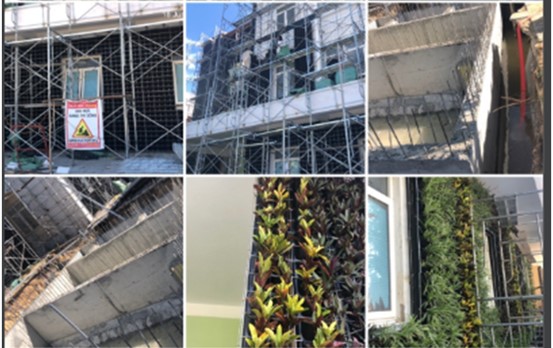
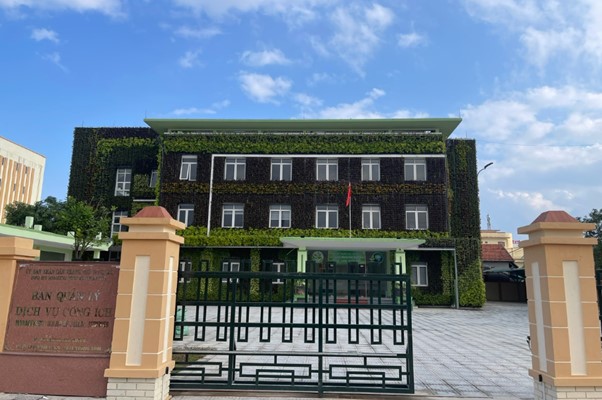
2) The green wall and green roof measure aims to conserve green spaces in the municipality in the face of increasing pressure to develop the natural lands due to rapid urbanization, contribute to the reduction of surface temperature and heat stress during hot summer months and flood risk mitigation, green-blue components (e.g. trees, vegetation layers...). The measure is designed with facade greening on exterior walls and a rooftop garden replaced the traditional corrugated iron-roof of the building adjacent to a rainwater harvesting system.
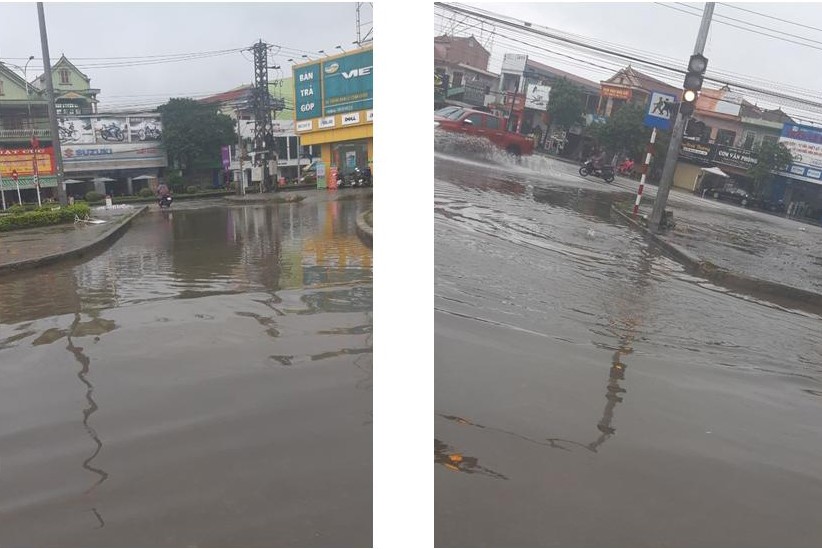
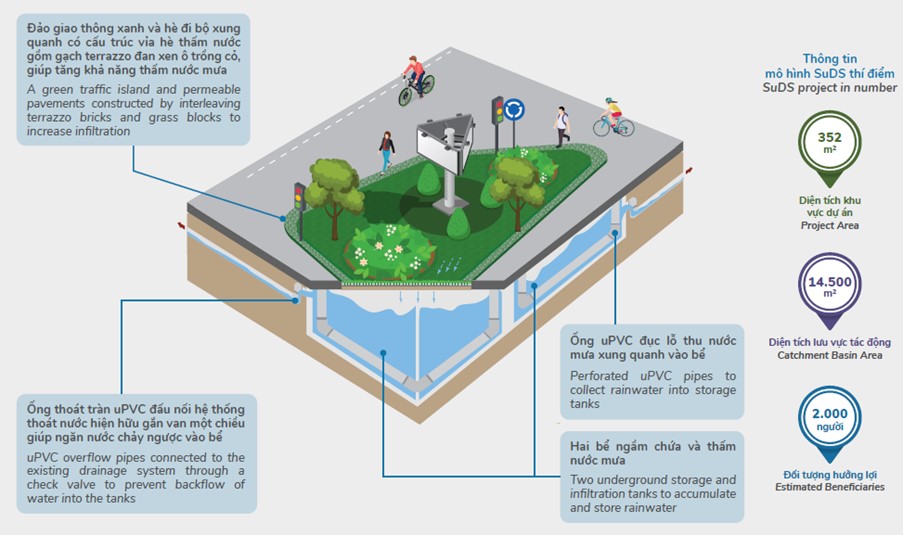
3) The Sustainable Urban Drainage System (SUDS) aims to enhance the drainage system through applying a nature-based approach in the construction and operation of the system to improve the flood management in the urban area. It helps to address the problem of local hotspot flooded areas during heavy rainfalls or typhoons in Dong Hoi city. The measure is designed and implemented with following components:
- Two underground storage tanks with storage capacity of 150 m3 with soak-away structure
- Eight inlets to collect rainwater on the road surface around the site
- Perforated uPVC collection pipes that are connected to the existing drainage system with a one-way backflow preventer
- Sidewalk paving slabs replaced by permeable structure
- Green trees to increase water permeability on land surface
The results showcase the effectiveness and possibilities of green interventions in helping the city to cope with increasing temperatures, flood management and energy efficiency while reducing GHG emissions. On top of that, lessons learnt and practical experiences in terms of technical knowledge, methodology and approach were shared, expanded and integrated into provincial technical standards, urban planning and relevant binding documents.
In fact, in order to finalise the urban EbA measures at site after the selection process, there were different steps required according to Viet Nam's legal frameworks and project's procedures:
- Site assessment: Planning an urban EbA measure required a thorough site assessment of the local climatic and geographical conditions to inform the optimum design and installation requirements. A comprehensive site assessment examined climate, hydrology, soil and water conditions on meso- and micro-level and takes into account the existing built environment.
- Planning: At this step, it was important to set an upfront goal of each urban EbA measure as this will influence the design, construction and level of maintenance required for the system. The scale, relationship to other facilities, benefits and impacts to communities and region, problems to be addressed were defined and elaborated. In addition, stakeholder engagement needed to be considered to define relevant involved parties and their roles, specialists, technical designers and service providers. All relevant procedures and regulations were figured out as well.
- Design phase: The crucial step of this phase was to develop a technical design document for the measure. Based on the set goals, site assessment results and requirements, the designers and technical experts prepared the technical drawings and the design report. Aspects related to size, functional components, technology, materials, timeline and cost estimation needed to be included. Consultation process to present the technical design was conducted for comments and feedback from different stakeholders before submitting all files for approval by local authorities. Upon the approval of the technical design document, the process to obtain the construction permit needed to be carried out according to government regulations.
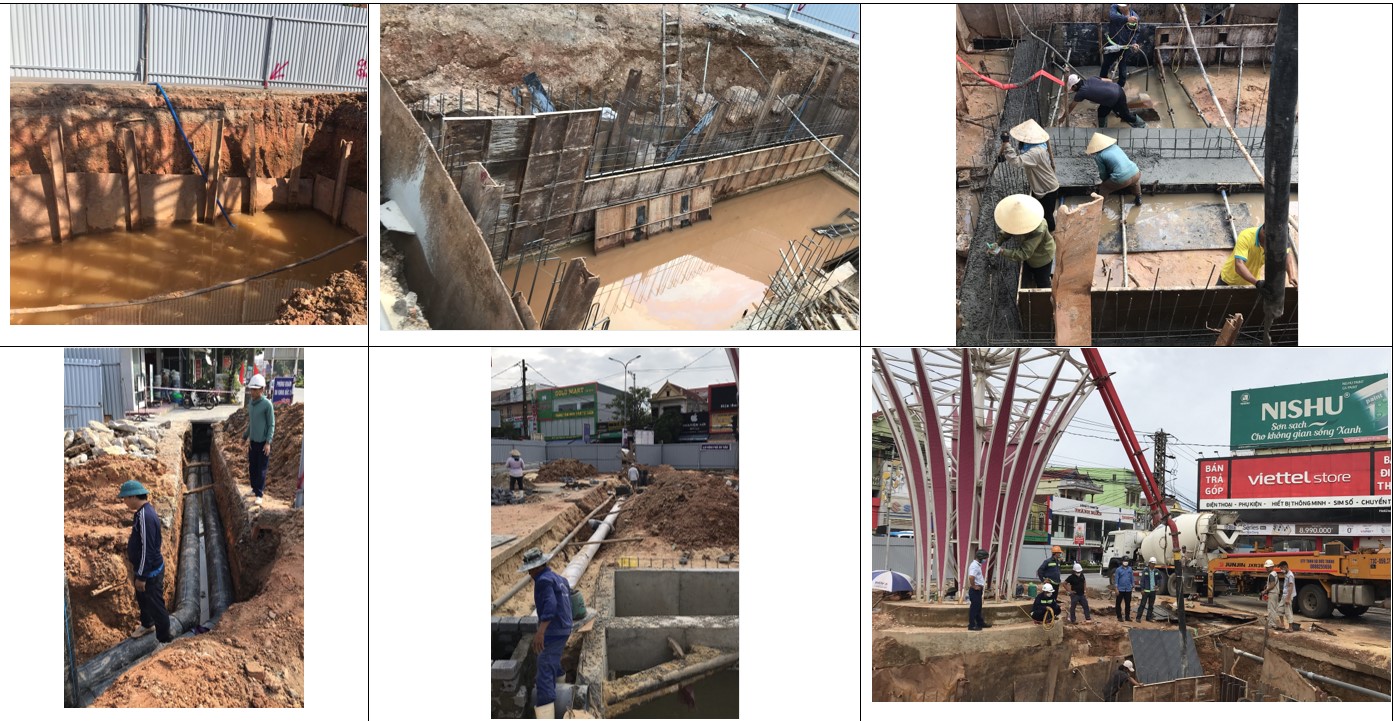
- Implementation: The construction implementer and construction supervision consultants were selected through a bidding process. An implementation plan was worked out and agreed by all relevant stakeholders before construction on the site. Local authorities and project partners took the roles of overall management, monitoring the work progress. Monthly meetings were conducted to update the progress and deal with arising issues during the implementation. The relevant government regulations and standard requirements needed to be complied fully and strictly at this phase. At the end of this phase, the implementation guidelines, lesson learnt and leaflets to promote the results were developed and shared in public for awareness raising and upscaling in the region.
- Engagement of private sector: After participating in all consultation stakeholder and urban EbA measure selection processes, private sector is interested in involvement and application of urban EbA approach in their daily work implementation to enhance their capacity and knowledge in this field. In particular, the Environment and Urban Development Company has together with the project worked out co-implementation plan for SUDS measure due to it is in line with their mandate and professional experiences. Moreover, the company has committed to cover 50% of the cost for implementation of the SUDS measure from their company yearly budget. Besides, upon the completion of the measure, the company currently covers the maintenance cost for the measure.
- Maintenance: Upon the completion of the implementation phase, the urban EbA measures were handed over to provincial partners. A consultation process was conducted to agree upon the roles and responsibilities on management, operation and maintenance of the work by parties who took over. Planning and budget allocation was prepared and committed to on the partner side.
In fact, the three measures are applied the “Delay-Store-Drain” approach of the Living Water Principles1 in improvement of flood management, natural ecosystems in urban areas. These combined hybrid, blue-green elements of the three implemented measures help to enhance the urban landscape while contributing to reducing current climatic risks, with a particular focus on flood risks and heat-stress in the city. Three implemented urban EbA measures are integrated measures which have clear linkage and complimentary solutions in enhancing climate resilience and ecosystem services maintenance of Dong Hoi city. Meanwhile the Water retention area measure contributes to the reduced urban runoff discharge pressure through the creation of open field retention, waterscapes recharging, increasing permeable surfaces and green spaces, vegetation cover on land surface of the city, the Green wall green roof measure presents complimentary options for creating green spaces on the building to reduce heat stress and provide direct cooling to the buildings, increasing water storage and regulating stormwater runoff through rainwater harvesting components. Additionally, the Sustainable urban drainage system contributes to enhance city drainage system for flood management improvements.
During the stakeholder consultation and urban EbA measure selection processes, gender approach is always considered through engagement of at least 50% women participants in all events and discussion and all their inputs are recognized and integrated into the final results.


")
