Recognition Modelling

Due to the excessive number of features, a 10-fold cross-validated SVM-RFE was used to rank the importance of the features after extracting them, and then the features were added sequentially for LDA classification to record the change in accurancy with the number of features selected, and finally the best number of features was recorded as the input for the subsequent classifications (see Fig. 8). The highest accurancy for LDA classification was 89.2% (pre) / 95.6% (pre + n×mR0).


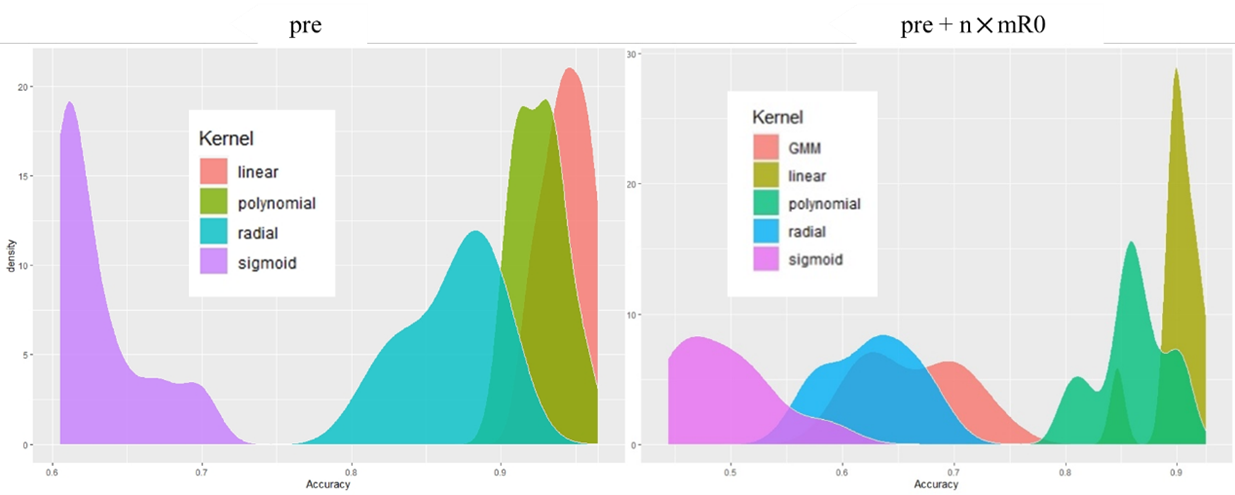
Since none of the MFCCs extracted with a fixed number of windows achieved better results than the GMM fitting method for LDA classification (6-window: 86.6%; 10-window: 88.5%; 100-window: <80%), we tested the effectiveness of the other classifiers using only the features extracted by the GMM fitting method. In this test, we randomly selected 20% of the data as the test set, and the rest of the data were used to train the classifier, which were repeated 10 times for each kernel function to record the distribution of the accuracy. Among them, the classification effect of GMM is poor when using only pre as MRU, while the effect is generally better than using only pre when using pre + n×mR0 as MRU. 

There are many classifiers that ca be used for individual recognition. Considering the performances and possibilities of the classifiers, this research compared the classification effectiveness of three classifiers that have been developed considerably in the field of gibbon bioacoustics or human sound pattern recognition, i.e., (1) linear discriminant analysis (LDA), (2) support vector machine (SVM) and (3) GMM (classification by determining the similarity between the data to be measured and the existing data). 


The basic method of sound pattern characteristics extraction has been identified, and a preliminary system method for individual sound recognition of Hainan gibbons has been established. Our preliminary results show that the existing system method is relatively reliable, and is to achieve the expected goals of the project. Among them, using pre + n×mR0 as MRU, extracting sound pattern characteristics using GMM fitting method, and using linear SVM for classification would be more effective. In the follow-up work, the data of rare individuals will be constantly supplemented, and design of the algorithm system will be improved, the ability of the classifier to recognise unknown individuals will be given, and the performance of the system will be comprehensively evaluated, so as to ultimately realise the recognition of individual sound of Hainan gibbons.

Sound pattern analysis

The manual screening of 532 Hainan gibbon acoustic sample has been completed, including those obtained during tracking and observation of gibbons using a portable recorder and those obtained using an automated recorder. During the screening process, three recording qualities were initially categorized, namely hight, medium, and low. 44 high-quality recordings from seven individual callers were obtained. The seven individual callers were GAM1、GBM1、GBSA、GCM1、GCM2、GDM1、GEM1, where the letter after “G” represents the family group number and the letter after “M/S” represents the individual number of adult male/subadult male individual number. Only about 40.9% of the recordings were made manually. The raw files of all automated recordings were provided by the team of professor Wang Jichao, and the related data were backed up at Hainan Institute of National Park.


Mel-frequency cepstrum coefficients (MFCCs) is a method of extracting frequency envelope features by cepstrum after weakening the high-frenquency information on the basis of human hearing[1], which has a wide range of applications in the field of human and bioacoustics. In this study, MFCCs and the first-order and second-order differences (△、△2) are used to achieve automated feature extraction.


5 signature notes of the male Hainan gibbon have been identified (Fig.1), including boom note, aa note, pre-modulated note, modulated-R0 note, and modulated-R1 note. 


According to the acoustic niche hypothesis, the calls of different species are differentiated in the time and frequency domains (see Fig. 2), so extracting features in a specific frequency range can greatly reduce the influence of noise, and the smaller the frequency range delineated, the more likely it is that more noise will be excluded. In addition, when the structure of each minimum recognition units (MRUs) is the same, the difficulty of recognition is greatly reduced.


In view of the above situation, in this phase of the research, we tried (1) applying pre only and (2) using pre + n×mR0 as MRU, respectively, and comparing the classification results so as to determine the most appropriate feature extraction in the subsequent work. In the case of voice annotation, all the above steps can be implemented automatically by R language code.
Experimental monitoring system

The experimental monitoring system consists of a set of parameters to track the behaviour of the species, visitor mobility practices, and risk detection:

  • GPS transmitters: they are programmed for data collection and with a download scheduling; there is a zoning around the nest.
  • Axis Station software: Axis Loitering Guard tracks moving objects and triggers alerts (e.g. a user exists the trail for x amount of time), sound alerts, and notifications when a threshold is exceeded. Axis Fend Guard detects interaction events (e.g. the bird leaves the next, two users leave the trail).
  • Alerts for potential mortality, potential territory expulsion, absences at the nest, users near the nest, and noise thresholds.
  • Other data related to trail usage by user type and the Bonelli’s eagle breeding process.
  • Annual reports on raptor spatial mobility, semi-annual reports on interactions and critical events.

It is essential to count on a simple-to-use software programmed with the desired parameters. It is fundamental to make the parameters as relevant as possible to the specific monitoring needs, and as concise as possible so that park managers are able to do a proper follow-up and respond to any alerts.


It should be noted that certain situations involving wildlife cannot be controlled. For example, in our case, we faced the reproduction failure of the pair of Bonelli's eagles, which partly modified the monitoring objective.

Although the use of a more sophisticated alert management software based on artificial intelligence is being explored, a simple software such as Axis Station can do the trick to start developing a functioning monitoring programme that notifies critical risk events. Processes and procedures for pre-alert management and data collection and analysis need to be periodically optimised based on the lessons learned during the process.


Installation of the technological infrastructure

The technological infrastructure is composed of two cameras along the nearby trail to monitor visitor flows, and a panoramic camera in front of the nest, which were installed in October 2022. The cameras are powered by solar panels and also have integrated mics that detect noise disturbances. Two GPS transmitters, installed in December 2022, are used to track the behaviour of for the pair of eagles. Data transmission from the cameras is carried out through point-to-point microwave antennas via a separate Internet line. The information is stored on the NAS and on Huawei’s cloud. The GPS units include a small solar power plate, and the data is transferred via radio frequency to the Move Bank cloud.

To enable the success of this building block, it is essential to count on the technical equipment (GPS trackers and cameras), a wireless connection to allow data transmission, and a storage system. Human capacity to know how and where to install the equipment in order to avoid disturbances to the species is also key, ensuring that the reproduction cycle of the species isn’t affected.

As in many experimental projects, the monitoring programme encountered technical challenges, mainly due to connectivity issues and the need to coordinate various systems and teams. Legal-administrative considerations, such as data use and installation permissions, are also essential when implementing this building block.


Concerning the GPS trackers, the programming of the transmitters according to different geozones makes it possible to optimise the reception of locations and improve the updating of the data for possible emergency inquiries. Besides, the double solar plate transmitter model placed on the female has proven to be more effective than the single plate model placed on the male during the months of less insolation.


The nest camera needs to be installed using and adequate distance to avoid disturbances while ensuring a good image resolution. In this case, the need for a higher-resolution device has been identified in order to make a good interpretation of the behaviour, identify the ringed individuals and their preys, as well as to implement the automation of alarms.     

Incorporate Coffee Development Measures into Forestry Policies

The purpose of this building block is to develop agroforestry systems management policies in line with coffee growing and link them to the country's forestry development policies, responding to the challenges of the market and applicable international legislation.

In essence, it is necessary to promote incentive policies (economic and/or commercial) that stimulate agroforestry in coffee plantations at the same time, the value chains in the forestry sector as small timber.

This requires two main elements:

  1. The ability to adjust forestry programs to accommodate agroforestry elements, without undermining coffee production but maintaining the spirit of the forestry policy.
  2. Encourage intersectoral dialogue around the issue of agroforestry in coffee plantations, in order to identify points of technical and political coincidence.

To illustrate this building block, the case of the Forestry Incentives Program of Guatemala -PROBOSQUE- is used; which made adjustments to the modality of forestry incentives in the agroforestry modality, changing parameters to include the cultivation of coffee, having a greater impact.

  1. To have a clear forest policy framework, which first, determines the scope of its objective as a public policy, the subject that expects to benefit and the expected results of its implementation; second, the issues where it can and should generate synergies to achieve the objectives of the forest policy.
  2. To have consolidated public policy instruments that allow interaction with other productive sectors. Guatemala's Forestry Incentives Program -PROBOSQUE- originated in 1996 and continues to operate to date.
  1. The development of pilot initiatives is required to evaluate and/or test the technical hypotheses of the different stakeholders in adjusting public policy instruments; in this case the public forestry sector and the organized private coffee sector.
  2. Extensive internal and external discussion and consultation processes are required among the different stakeholders to achieve the benefits of the different sectors, without affecting the institutional and legal mandates that the stakeholders must comply with.
  3. Technical materials need to be developed in order to communicate and disseminate information to potential stakeholders on the new modalities offered by public policy instruments.
Integrated Approaches to Peacebuilding Through Joint Livelihoods

The PEACECORE project uses sustainable, climate conscious livelihood support as a tool to restore traditional, and create new, trade and exchange opportunities for farmers and herders in 6 Local Government Areas of Plateau State, Nigeria. The aim is to replace negative conflict behaviors with mutually beneficial economic relations, while mediation and dialogue also supported through the first building block. Participants from communities affected by conflict have been brought together and trained across various organic agricultural and dairy value chain opportunities, cooperative formation and operation, and conflict resolution. Through such efforts we have been able to bring together conflicting livelihood groups of farmers and herders to establish trade agreements and form cooperatives around value chains including organic fertilizer supply, supply of cow dung and crop waste for briquette production, fodder and forage production, dairy and tofu production etc.

  1. The selection of value chains that are beneficial to both parties such as fodder production, organic fertilizer.
  2. Strong reputation of GIZ in implementation of agricultural and development programmes meant participants were willing to trust the process.
  3. Willingness of conflicting partners to find solutions to the conflict.
  4. Availability of resources for the project and initiatives such as technical skills and equipment, financing etc meant that participants could create tangible structures and operations.
  1. Trust building is essential as well as involving participants across all stages of project interventions.
  2. Adding value to existing business and products is a useful first step to engagement.
  3. New ideas and processes are welcome as long as the benefits can be perceived.
  4. Using connectors (things that both parties need in common) is essential.
Measuring the Impacts on Ecosystem Services

The objective of this building block is to provide developers and implementers of ecosystem and landscape restoration projects with a tool that uses remote sensing, augmentation factors, and the integration of the two as a way to evaluate the effectiveness of restoration interventions on the ground.

To evaluate the line of impact of ecosystem services based on remote sensing, baseline data (baseline, management units and recent images) are collected and the differential between the initial and final year is calculated through: the definition of the increment tables, the normalization and adjustment of images, and the modeling of ecosystem services.

The increment factor approach is used for cropland and/or livestock where spectral indices derived from satellite imagery fail to accurately detect vegetation changes; and is calculated through: definition of baseline data, categorization of restoration practices and estimation of increment factors per implemented measure.

By executing this process, the area directly and indirectly impacted is available.

  • Have a baseline with the same variables and geospatial models to make credible and reliable comparisons over time.
  • Have a database of management units that clearly reflects the restoration actions that were executed in the field.
  • Implement a training and capacity building process with an assigned advisor, where doubts and uncertainties about methodological aspects and technologies to be used are resolved, which facilitates their adoption.
  • The databases that include the restoration measures in the territories should be reliable and preferably have been verified through supervision and control of data in the field.
  • If the developers and executors of restoration projects implement these methods in different areas, it is important to homogenize the variables, their treatment and the scale at which they execute them.
Elaboration of a Database on Restoration Measures

The objective of this building block is to provide developers and implementers of ecosystem and landscape restoration projects with a tool for collecting key information in the field to measure the impact of proposed restoration actions.

The steps for its implementation are:

  1. Survey of management units: provides complete information on the sites selected for restoration actions and includes; name and sex of the producer, correlative number and code of the management unit, administrative boundaries, geographic coordinates, area and legal status of the management unit, predominant land use and a photograph of the site.
  2. Survey of the management subunits: provides complete information on the specific restoration measures to be implemented in the selected sites and includes; the codes of the management subunits, coordinates and areas of the management subunits, current land use, future land use, restoration measures and practices to be implemented.

By executing this process, information is available that relates restoration actions to the improvement of ecosystem services in different parts of the landscape.

  • Incorporate new technologies and work distribution schemes to make field data collection and processing cost-effective.
  • Develop communication and performance protocols between office and field teams to collect quality data.
  • Have a supervision scheme that provides timely feedback to data collection and processing, while avoiding reprocessing.
  • The process of collecting management units is the most time-consuming part of this solution (estimated to be 2% of the project's execution cost), and therefore requires detailed and precise planning of the technologies to be used, the number of personnel required and the ways in which the data will be processed, as failure to do so in an appropriate manner may increase costs.
  • To take care of the processing and quality of the data, cross supervisions (internal personnel of the organization that is not linked to the project) or outsourced (external personnel that have been hired for this purpose) are required, which can identify inconsistencies in the databases and what has been executed in the field.
Ecosystem Services Baseline Construction

The objective of this building block is to provide developers and implementers of ecosystem and landscape restoration projects with a tool that uses remote sensing and geospatial data to determine the current state of ecosystem services and the sites where specific restoration measures can be implemented.

The steps to execute it are as follows:

  1. Preparation of baseline data: it forms a cartographic series that includes information on the project area, topography, climate, soil and forest cover.
  2. Hydrological and soil analysis: results in the water erosion map and the water infiltration map of the project area.
  3. Structural landscape analysis: results in the biological connectivity map of the project area.
  4. Integrated landscape analysis: results in the ecosystem services index and its map in different territorial management units.
  5. Generation of suitability indexes: results in 7 soil suitability maps to apply specific ecosystem and landscape restoration measures.
  • Have access to official geospatial information sources.
  • Implement a training and capacity building process, where doubts and uncertainties about methodological aspects and technologies to be used are resolved, which facilitates their adoption.
  • Have an advisor or mentor during the process; this facilitates the resolution of doubts or queries arising from the execution of the instruments; a single process of accompaniment is sufficient, as it develops a strong foundation for future replications.
  • It requires a technician with basic knowledge of GIS, since it requires access and manipulation of tools, data and platforms very specific to this sector.
  • The execution of the process is not time consuming, however, it requires time and exclusivity to perform it (more, if it is the first time it is executed); which are reduced with each new replication process.
Decentralized Community Dialogue Platforms

The project has brought conflicting parties using platforms such as the Community Peace Architecture Forum CPAF and the People First Impact Method P-FIM. This approach has succeeded in bringing people at the community level together to discuss and resolve their issues at the local level using community driven solutions. Communities have been able to resolve disputes arising through mediation of the CPAF and articulate their needs, and goals through P-FIM. All of which have helped the project to design and deliver on its objectives with the buy in of local communities.

1. Involvement of local actors, stakeholders and capacities for peacebuilding.

2. Creating a safe space for dialogue and discussions.

3. Strengthening the capacities of local civil society organizations familiar with the communities and trusted by them to better implement.

4. Decentralised strategy.

5. Empowering structures to mediate directly in conflict, with links to relevant authorities.

1. Mediation is easier at local levels where the conflicts occur, than through centralized strctures which might be more cumbersome and present generalized solutions which might not be adequate to local challenges.

2. Communities have capacities for resolving conflicts and addressing their developmental issues by themselves. These should be identified and supported over external solutions as they are often more sustainable.

3. Bottom to top approaches are more effective than top to bottom approaches.

4. Decentraization of dialogue structures at community level, reduces the logistics of conducting such dialogues and encourages their continuation after projects exit.