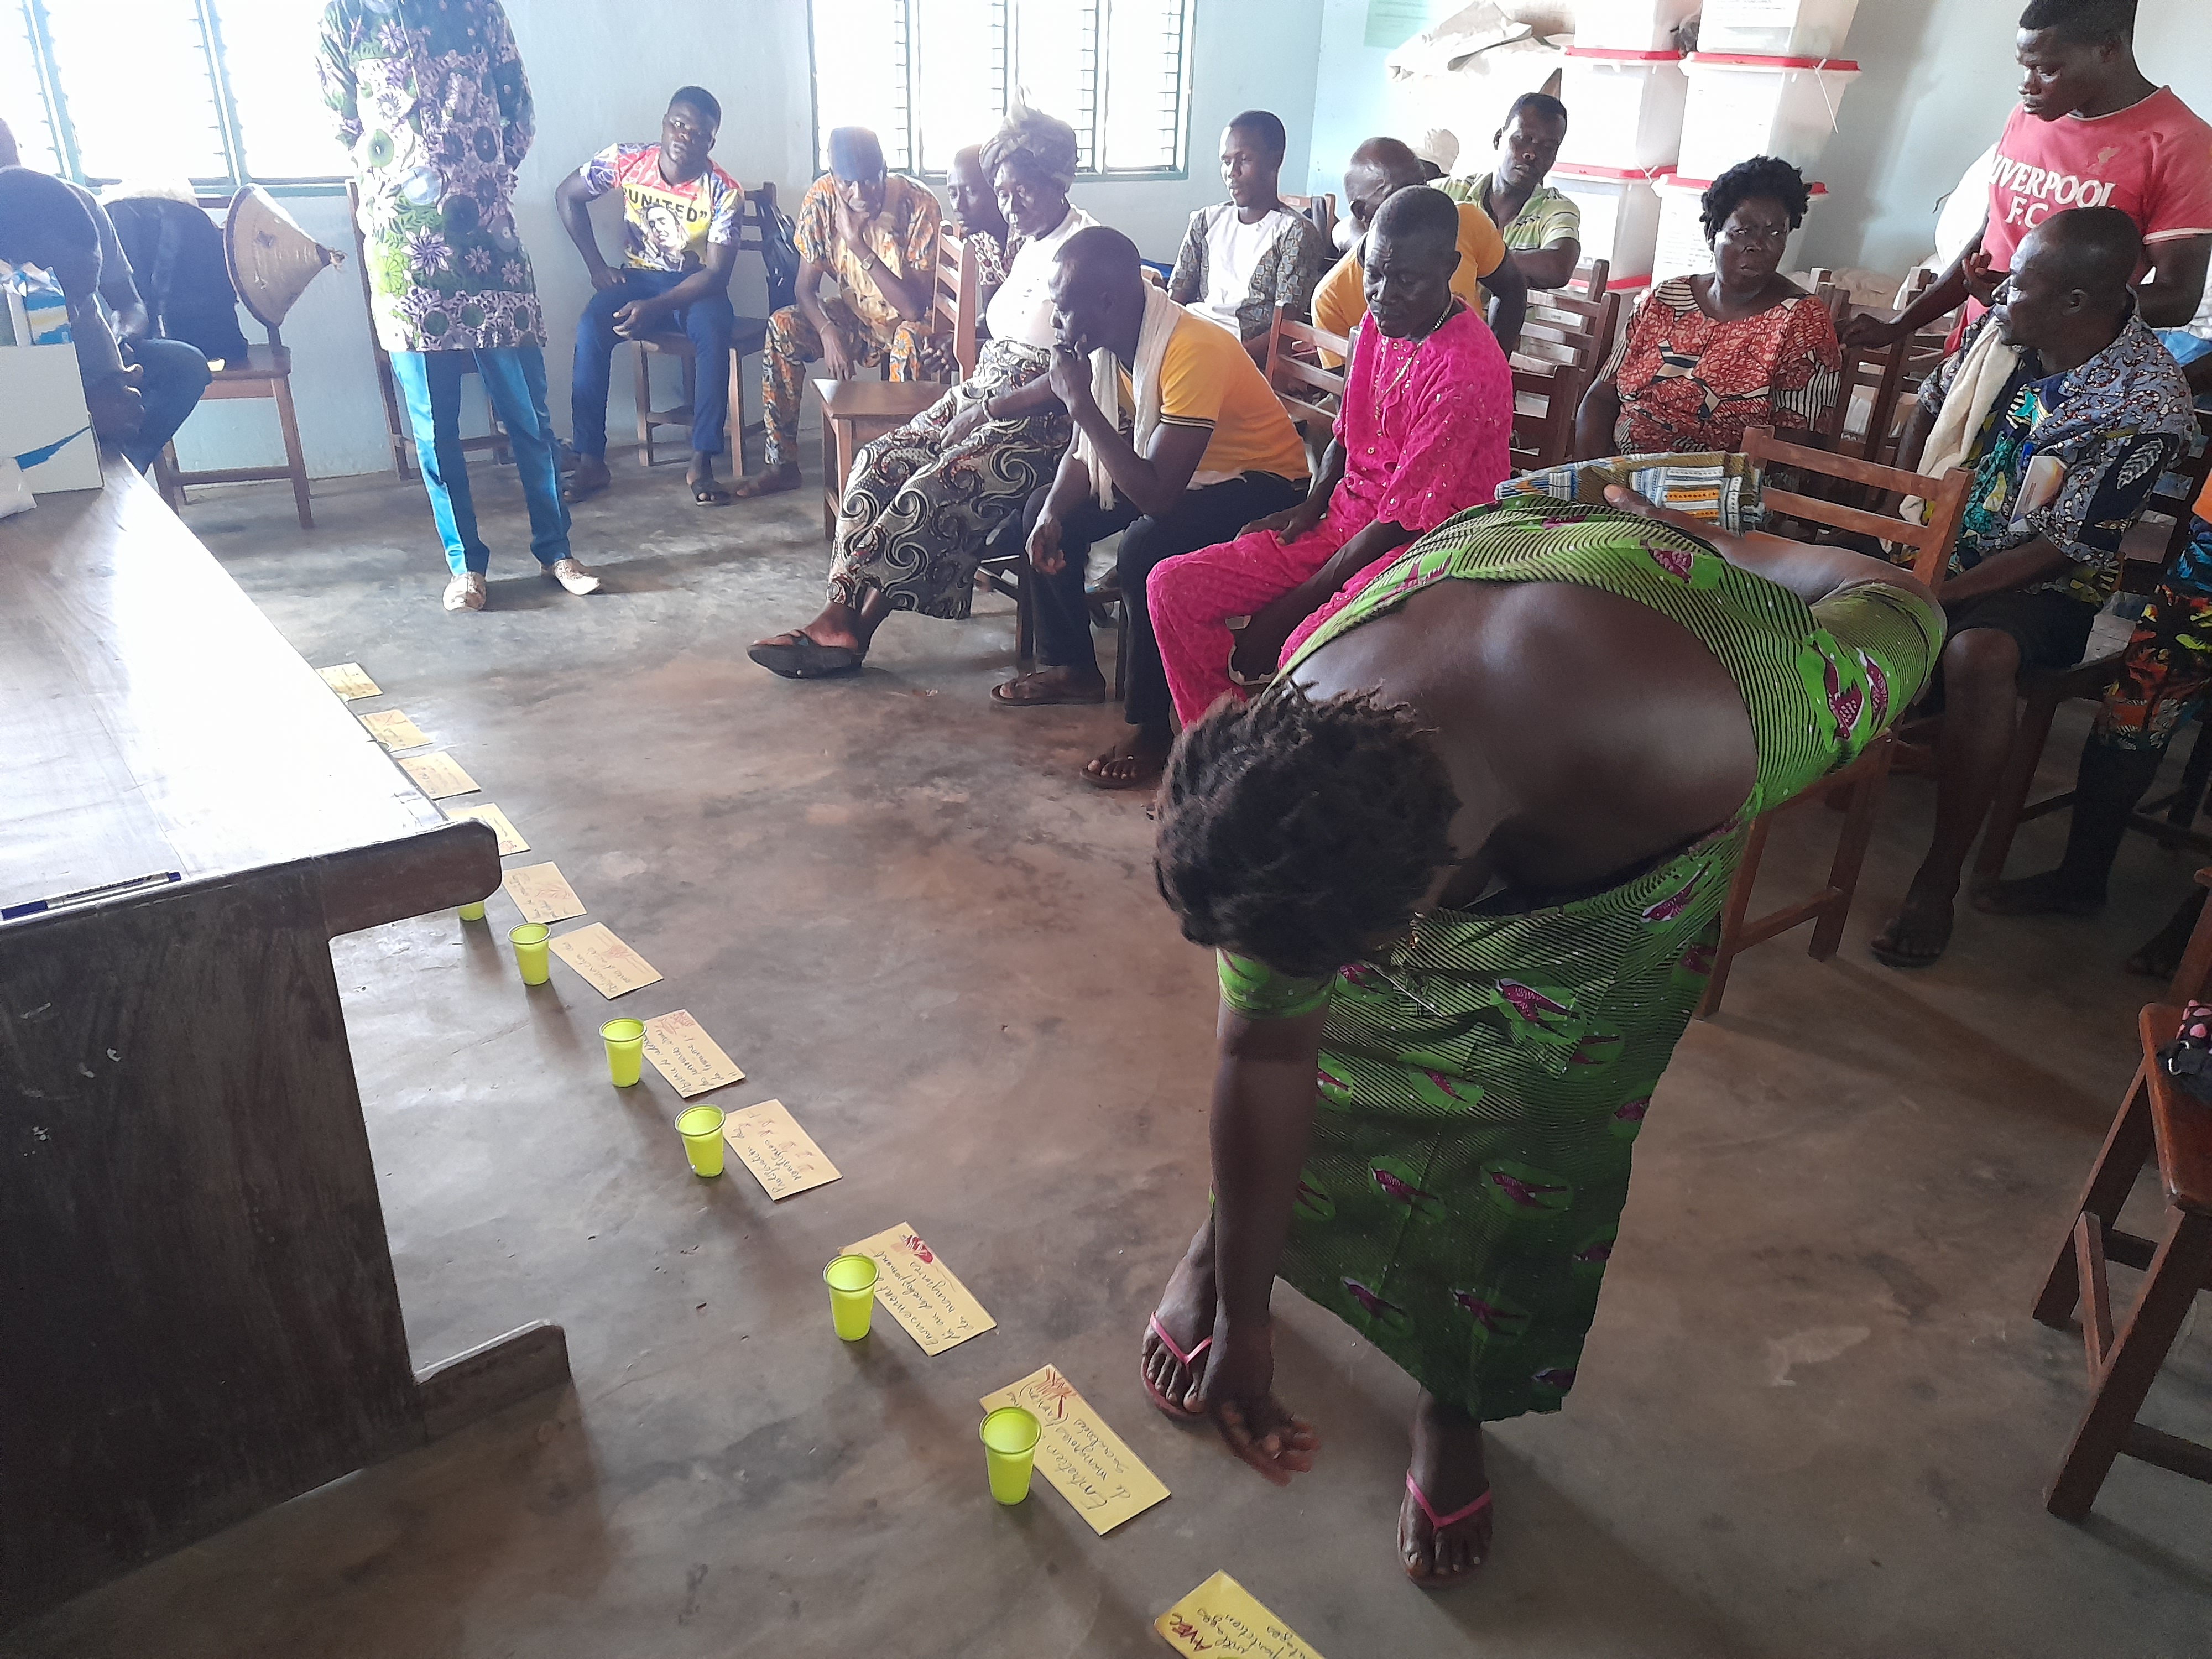
Local communities have acquired the skills needed to collect seeds and produce seedlings for the ecological restoration of degraded sites.
Petit Borendi training, September 2022
Cristina Romero
The guide was printed and distributed in pdf version online and in physical version, both free of charge, during public restitutions and meetings with partners identified during the interviews (block 1).
It was also used as the basis for training courses in seed harvesting and seedling production for ecological restoration, for people who had shown a willingness to take action. Training courses were therefore offered in existing community nurseries experiencing difficulties, and in vocational training institutes such as agricultural high schools or adult training centers.
Organized over one or two days, these training courses enabled participants to discover existing outlets in ecological restoration (harvesters, producers, planters, those responsible for ecological monitoring), as well as to acquire theoretical and technical knowledge through hands-on workshops. Participants learned how to recognize the plant species around them, observe fruiting, collect and store correctly, draw up follow-up sheets, start production (semi, transplanting, cultivation), and set up a plantation.
The involvement of local communities in the project from the outset has ensured the success of the training courses. In addition, word of mouth reached people throughout the region.
In addition, satisfaction questionnaires were distributed at the end of each training session, enabling continuous improvement.
Technical workshops in the environment in which the participants evolve and wish to work are essential in this type of training. It is therefore necessary to travel to the trainees' homes to give them hands-on training. It is also necessary to give importance to the empirical knowledge of trainees, so that it is valued and shared with all training participants. By co-designing the workbook with tribal members, we were able to observe that participants took to the tool more easily.
The most enthusiastic participants were women, who see nurseries as an activity they enjoy and a means of economic emancipation, and young people, who don't have many prospects and don't want to move to the city to work.
Nevertheless, the binder lacks an "economic" section to give an idea of investment and return on investment, as well as a governmental structuring of the sector.
